Unlock a world of possibilities! Login now and discover the exclusive benefits awaiting you.
- Qlik Community
- :
- All Forums
- :
- QlikView Integrations
- :
- Re: Another Google Maps Extension
- Subscribe to RSS Feed
- Mark Topic as New
- Mark Topic as Read
- Float this Topic for Current User
- Bookmark
- Subscribe
- Mute
- Printer Friendly Page
- Mark as New
- Bookmark
- Subscribe
- Mute
- Subscribe to RSS Feed
- Permalink
- Report Inappropriate Content
Another Google Maps Extension
UPDATE 2013-03-23
It's great to see the support from the community around mapping! This thread has been great to follow and lots of fun contributions has been added.
It has however become quite crowded with different versions being discussed and it's hard to find any useful information anymore.
So I have decided to kill off this thread and at the same time I have updated the extensions and split them into 3 parts with each extension having it's own thread.
Hopefully this will make it a bit easier to find information, ask questions and share new implementions of the extension between each other.
Google Maps - Cluster
http://community.qlik.com/message/325640
Google Maps - Marker
http://community.qlik.com/message/325641
Google Maps - Heatmap (New!)
http://community.qlik.com/message/325642
If there is interest for a more collaborative development let me know and I will host the extensions up on Git.
Message was edited by: Alexander Karlsson
- Tags:
- qlikview_extensions
- Mark as New
- Bookmark
- Subscribe
- Mute
- Subscribe to RSS Feed
- Permalink
- Report Inappropriate Content
I also had this I think it was kicked off from the measures setting ..
- Mark as New
- Bookmark
- Subscribe
- Mute
- Subscribe to RSS Feed
- Permalink
- Report Inappropriate Content
Dear Alexander,
First of all I would like to say many thanks for your contribute the cool map extension.
The "Map_infowindow" very very usfull for me. And I want to change marker color base on expression value.
Let say:
IF (Expression <0 , [Display Marker in Red Color],
If (Expresion = 0 , [Display Marker in Yellow Color],
IF (Expresion > 0 , [Display Marker in Blue Color])))
Please help me how implement this.
Thanks in advanced for your input.
Regards,
Sokkorn
- Mark as New
- Bookmark
- Subscribe
- Mute
- Subscribe to RSS Feed
- Permalink
- Report Inappropriate Content
Hi Alex,
I am designer and new to Qlikview. Can you pls explain me the step by step process how to use this?
We have a same scenario in our project. Basically client is logistic company we want to show them the shortest and longest route for the orgin and destination.
Can you pls help me here?
Rgds,
Nandha
- Mark as New
- Bookmark
- Subscribe
- Mute
- Subscribe to RSS Feed
- Permalink
- Report Inappropriate Content
Hi,
the extension looks good and works fine, but I have big trouble with one scenario. I created a QVW-File with the extension and everything works perfect. It is also possible to access the QVW and map via access point. But when I open the QVW and extension by iPad, no map is shown. I access our network with the iPad via VPN connection. I am able to open the access point and analyse my data, but the extension do not show the map.
Could it be a firewall issue? It is necessary to open special ports or to setup a special configuration for the VPN connection?
It would be great, if anybody can help me.
Thanks and kind regards,
Stephan
- Mark as New
- Bookmark
- Subscribe
- Mute
- Subscribe to RSS Feed
- Permalink
- Report Inappropriate Content
Hi Stephan,
It will be your iPad that is trying to access Google Maps so most likely it's your VPN that is in your way. It would be port 80 or 443 that is trying to access Google. I havent tried the extension on a iPad but let me fire mine up to make sure it is supposed to work.
Kind Regards
Alexander Karlsson
12 mar 2013 kl. 14:12 skrev "stephan.lies" <qcwebmaster@qlik.com<mailto:qcwebmaster@qlik.com>>:
QlikCommunity<http://community.qlik.com/index.jspa>
Re: Another Google Maps Extension
created by stephan.lies<http://community.qlik.com/people/stephan.lies> in Integration and Extensions - View the full discussion<http://community.qlik.com/message/320925#320925>
- Mark as New
- Bookmark
- Subscribe
- Mute
- Subscribe to RSS Feed
- Permalink
- Report Inappropriate Content
Hi,
Thank you very much, it works.
- Mark as New
- Bookmark
- Subscribe
- Mute
- Subscribe to RSS Feed
- Permalink
- Report Inappropriate Content
Hi Daniel,
I'm using your app and it works fine,
But I have another question,
My file contain same latitude and longitude for a part of my customers, how can I distinct them and show in my map each customer ?
Thank you very much ford your help,
- Mark as New
- Bookmark
- Subscribe
- Mute
- Subscribe to RSS Feed
- Permalink
- Report Inappropriate Content
If it's the exact same coordinates well Google Maps doesn't really handle that. One way could be to include that information as a info window or as a hover action. Potentially you could use a different marker color to let your users know that there is more then 1 customer for the marker.
Kind Regards
Alexander Karlsson
12 mar 2013 kl. 18:10 skrev "remihuss" <qcwebmaster@qlik.com<mailto:qcwebmaster@qlik.com>>:
QlikCommunity<http://community.qlik.com/index.jspa>
Re: Another Google Maps Extension
created by remihuss<http://community.qlik.com/people/remihuss> in Integration and Extensions - View the full discussion<http://community.qlik.com/message/321073#321073>
- Mark as New
- Bookmark
- Subscribe
- Mute
- Subscribe to RSS Feed
- Permalink
- Report Inappropriate Content
Hi, I hope its ok to ask an open question regarding mapping??
Ive attached a sample dataset of employess who 'swipe' in and out of rooms in particular building - which is refreshed every 10 mins.
If I had a floor plan of our building would it be possible to show the numbers of people in each room? Any thoughts or advice is appreciated.
Regards,
Fiorano
- Mark as New
- Bookmark
- Subscribe
- Mute
- Subscribe to RSS Feed
- Permalink
- Report Inappropriate Content
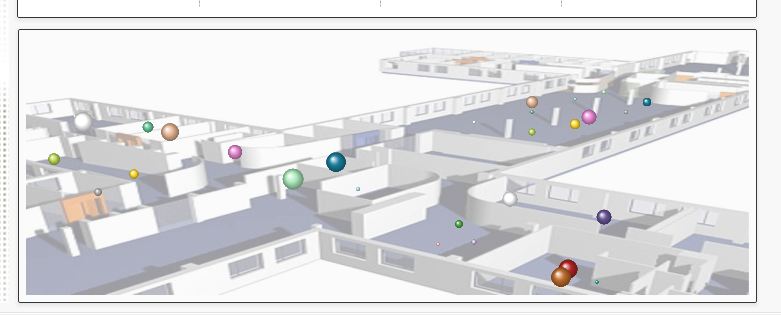
Fiorano,
I have done just that type of thing for a demo app that I have built. I have a static picture, then I use a piece of software called ICBXYPicker (but I'm sure anything that will take an image and allow you to plot co-ordinates against it would do), and then I mimic the google scatter chart, but use the image of the static picture instead, overlay the lat / long (x/y) and do my expression on the item I wanted to see - in this case number of calls per agent in a call centre, with the image showing where they are sitting. I've enclosed a pickie below and the app itself.
Cheers,
Julie