Unlock a world of possibilities! Login now and discover the exclusive benefits awaiting you.
- Qlik Community
- :
- All Forums
- :
- QlikView App Dev
- :
- summing/totals after crosstable import
- Subscribe to RSS Feed
- Mark Topic as New
- Mark Topic as Read
- Float this Topic for Current User
- Bookmark
- Subscribe
- Mute
- Printer Friendly Page
- Mark as New
- Bookmark
- Subscribe
- Mute
- Subscribe to RSS Feed
- Permalink
- Report Inappropriate Content
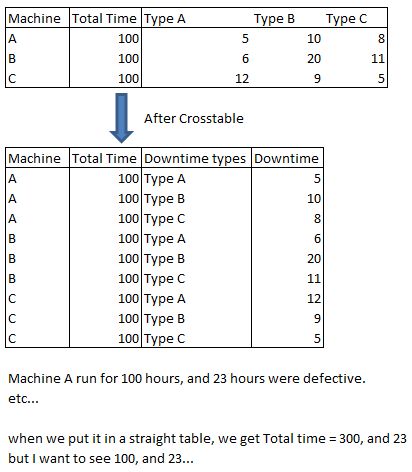
summing/totals after crosstable import
little example
- Tags:
- new_to_qlikview
- Mark as New
- Bookmark
- Subscribe
- Mute
- Subscribe to RSS Feed
- Permalink
- Report Inappropriate Content
If your "Total Time" is a solid number ( so not a calculation) you should show it as a dimension and not as an expression. This way it will show 100 for every row.
- Mark as New
- Bookmark
- Subscribe
- Mute
- Subscribe to RSS Feed
- Permalink
- Report Inappropriate Content
And get rit of your Downtime Types if you want to see them add up (23 for machine A)
- Mark as New
- Bookmark
- Subscribe
- Mute
- Subscribe to RSS Feed
- Permalink
- Report Inappropriate Content
You could use Avg([Total Time]) instead of Sum([Total Time])
- Mark as New
- Bookmark
- Subscribe
- Mute
- Subscribe to RSS Feed
- Permalink
- Report Inappropriate Content
thanks Dennis,
I cannot get rid of the different types.
It's also hard to put the totals as a number, since I need to do calculations on it :
| Machine | Total Time | Dowtime | Uptime | % |
| A | 100 | 23 | 77 | 77 |
| B | 100 | 37 | 63 | 63 |
| C | 100 | 26 | 74 | 74 |
etc
Maybe I have to load the table in 2 times, one time not as crosstable, and without the downtime types, and then a next time only the downtime types as crosstable, and create a common unique key to link them up?
But this looks like ambiguous programming? I think there must be easier solutions than this.
- Mark as New
- Bookmark
- Subscribe
- Mute
- Subscribe to RSS Feed
- Permalink
- Report Inappropriate Content
thanks Jason,
but how do I end up (Total Time) - Downtime, to calculate Uptime?
Uptime = avg(total time) - sum(downtime) doesn't work correctly...
- Mark as New
- Bookmark
- Subscribe
- Mute
- Subscribe to RSS Feed
- Permalink
- Report Inappropriate Content
I mean get rit of the Downtime Types as a dimension in your charts.
Then you will get 23 right?
Try this create a Strait Table:
Dimension : Machine
Expressions: AVG(TotalTime)
SUM(DownTime)
Column(1) - Column(2)
Column(3)/ Column(1) *100
Let me know if this is what you are looking for
Dennis.
- Mark as New
- Bookmark
- Subscribe
- Mute
- Subscribe to RSS Feed
- Permalink
- Report Inappropriate Content
Hi,
Why don't you just make another table of Machine and TotalTime.
and then link your TotalTime and DownTime table using the Machine.
So 2 tables can be
table1:
Machine,
TotalTime
table2:
Machine,
DowntimeTypes
DownTime
This should work for most of the scenarios.
But yes, If you have huge data Size then you may also think rather then making two tables using flags and set analysis on the same cross table only.
..
Ashutosh
- Mark as New
- Bookmark
- Subscribe
- Mute
- Subscribe to RSS Feed
- Permalink
- Report Inappropriate Content
Dennis just beat me to it! See attached 