Unlock a world of possibilities! Login now and discover the exclusive benefits awaiting you.
- Qlik Community
- :
- All Forums
- :
- QlikView App Dev
- :
- Change Y- Axis Scale
- Subscribe to RSS Feed
- Mark Topic as New
- Mark Topic as Read
- Float this Topic for Current User
- Bookmark
- Subscribe
- Mute
- Printer Friendly Page
- Mark as New
- Bookmark
- Subscribe
- Mute
- Subscribe to RSS Feed
- Permalink
- Report Inappropriate Content
Change Y- Axis Scale
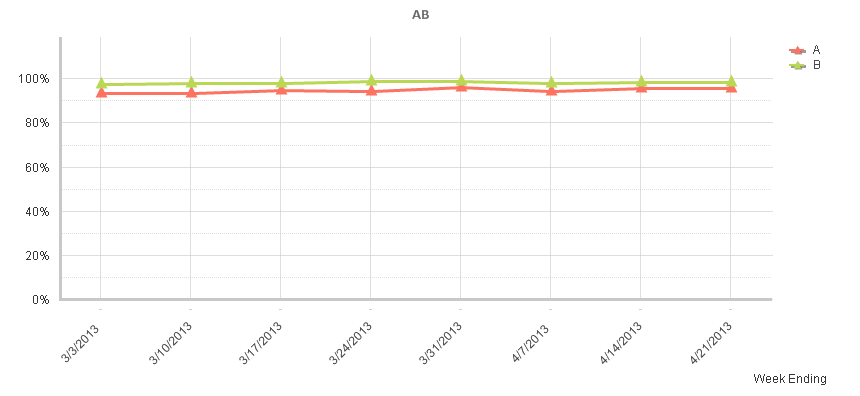
Line Chart Y-Axis scale is from 0% to 100%. I would like to change the scale to show only 80% to 100%, how do I change the scale.
Accepted Solutions
- Mark as New
- Bookmark
- Subscribe
- Mute
- Subscribe to RSS Feed
- Permalink
- Report Inappropriate Content
Open the properties window of the chart and select the Axis tab. There you can change the static max and static min settings for the expression axis. Set the static max value to 1 and the static min value to 0.8. Also make sure the option Forced 0 is unchecked.
talk is cheap, supply exceeds demand