Unlock a world of possibilities! Login now and discover the exclusive benefits awaiting you.
- Qlik Community
- :
- All Forums
- :
- QlikView App Dev
- :
- Re: if condition in load statement
- Subscribe to RSS Feed
- Mark Topic as New
- Mark Topic as Read
- Float this Topic for Current User
- Bookmark
- Subscribe
- Mute
- Printer Friendly Page
- Mark as New
- Bookmark
- Subscribe
- Mute
- Subscribe to RSS Feed
- Permalink
- Report Inappropriate Content
if condition in load statement
Hi All,
table:
load
id,
column 1
from test.qvd
The information in the columns are like below
id column1
1 a
2 b
3 c
4 a
5 c
6 b
7 d
8 d
I would like to group all the a and b to name the column ab and c and d to be column cd.
I tried to use if function in the load script but I think this is not the right option.
Could you please advice ?
Accepted Solutions
- Mark as New
- Bookmark
- Subscribe
- Mute
- Subscribe to RSS Feed
- Permalink
- Report Inappropriate Content
Can you use like below
LOAD id, column1, If(WildMatch(column1,'A','B'), column1) as ab, If(WildMatch(column1,'C','D'), column1) as cd;
LOAD * Inline [
id, column1
1 , A
2 , B
3 , B
4, C
5, D
6, D
7, A
8, C
9, A
10, B
];
- Mark as New
- Bookmark
- Subscribe
- Mute
- Subscribe to RSS Feed
- Permalink
- Report Inappropriate Content
What would be the output from given data
- Mark as New
- Bookmark
- Subscribe
- Mute
- Subscribe to RSS Feed
- Permalink
- Report Inappropriate Content
| Main qvd | My new Chart1 | My new Chart2 | |||||||||
| ID | Name | Status | ID | Name | Status | ID | Name | Status | |||
| 1 | Jo | A | 1 | A | 4 | Mo | D | ||||
| 2 | Mo | B | 2 | B | 5 | to | D | ||||
| 3 | to | B | 3 | B | 6 | Mo | A | ||||
| 4 | MO | C | 7 | A | 8 | to | C | ||||
| 5 | Mo | D | 9 | A | |||||||
| 6 | to | D | 10 | B | |||||||
| 7 | Mo | A | |||||||||
| 8 | to | C | |||||||||
| 9 | Mo | A | |||||||||
| 10 | to | B | |||||||||
- Mark as New
- Bookmark
- Subscribe
- Mute
- Subscribe to RSS Feed
- Permalink
- Report Inappropriate Content
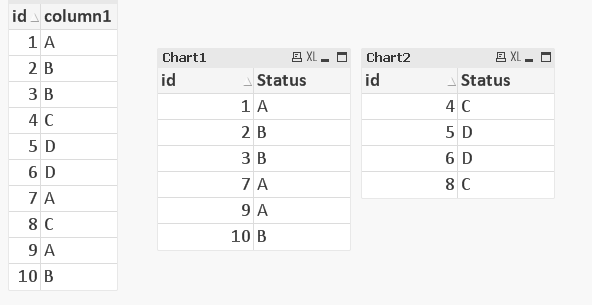
Like this?
- Mark as New
- Bookmark
- Subscribe
- Mute
- Subscribe to RSS Feed
- Permalink
- Report Inappropriate Content
Yes
- Mark as New
- Bookmark
- Subscribe
- Mute
- Subscribe to RSS Feed
- Permalink
- Report Inappropriate Content
I want to create chart1 and chart2 using first table because this is my qvd.
I tried something like this:
table:
load
id,
column1,
if(column1= 'a',if(column1='b')) as ab,
if(column1 = 'c', if(column1= 'd)) as cd'
from test.qvd
Then I want to make a table box to look like this:
chart1
id ab
1 a
2 b
3 a
and
chart2
id cd
4 c
5 d
6 c
- Mark as New
- Bookmark
- Subscribe
- Mute
- Subscribe to RSS Feed
- Permalink
- Report Inappropriate Content
Can you use like below
LOAD id, column1, If(WildMatch(column1,'A','B'), column1) as ab, If(WildMatch(column1,'C','D'), column1) as cd;
LOAD * Inline [
id, column1
1 , A
2 , B
3 , B
4, C
5, D
6, D
7, A
8, C
9, A
10, B
];
- Mark as New
- Bookmark
- Subscribe
- Mute
- Subscribe to RSS Feed
- Permalink
- Report Inappropriate Content
Chart 1
Dimension:
ID
Name
Expression:
only({<Status={'A','B'}>}Status)
Chart 2
Dimension:
ID
Name
Expression:
only({<Status={'C','D'}>}Status)
- Mark as New
- Bookmark
- Subscribe
- Mute
- Subscribe to RSS Feed
- Permalink
- Report Inappropriate Content
A big thank you!