Unlock a world of possibilities! Login now and discover the exclusive benefits awaiting you.
- Qlik Community
- :
- All Forums
- :
- QlikView App Dev
- :
- help about listbox seletion
- Subscribe to RSS Feed
- Mark Topic as New
- Mark Topic as Read
- Float this Topic for Current User
- Bookmark
- Subscribe
- Mute
- Printer Friendly Page
- Mark as New
- Bookmark
- Subscribe
- Mute
- Subscribe to RSS Feed
- Permalink
- Report Inappropriate Content
help about listbox seletion
hi
I have a listbox (Year in this image).in this listbox I have two years (94 and 95).when I select 94 or 95 the text box
above the first line chart shows the daily mean of sales in month that selected in second listbox(Month)
But when I selected two years(94 and 95) the daily mean of sales in month that selected in second listbox(Month)
Will be wrong.because it calculated for two years in same month
I need to calculate daily means for Year=95 not 94 and 95 and show it in textbox above the line chart.please help me.
Thanks
Message was edited by: Mohammad hoseini
- Mark as New
- Bookmark
- Subscribe
- Mute
- Subscribe to RSS Feed
- Permalink
- Report Inappropriate Content
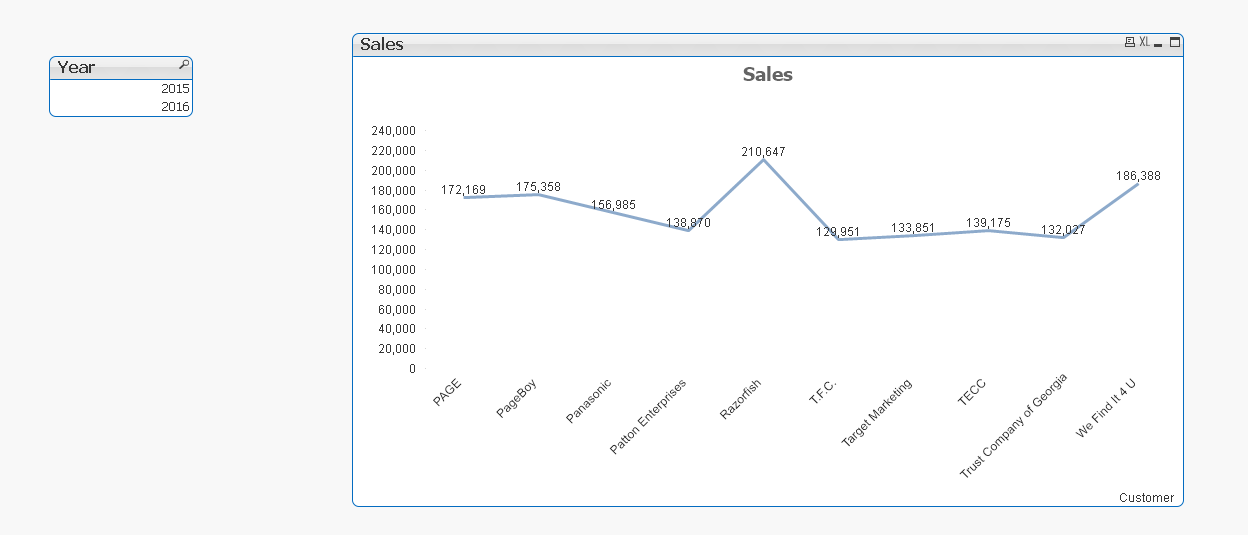
hi
i have a list box that show two years in it (like 2015 and 2016)
i have a line chart that shows sales of 2016
when i select both two years in listbox i wana that chart caption shows only the average of 2016 sales not 2015 and 2016
how we can do it?
- Mark as New
- Bookmark
- Subscribe
- Mute
- Subscribe to RSS Feed
- Permalink
- Report Inappropriate Content
Hi,
May be like this,
If(GetselectedCount(Year)=0,Sum({<Year={'$(=Max(Year))'}>}Sales),Avg({<Year={'$(=Max(Year))'}>}Sales))
Using this above expression.
PFA,
HTH,
Hirish
“Aspire to Inspire before we Expire!”
- Mark as New
- Bookmark
- Subscribe
- Mute
- Subscribe to RSS Feed
- Permalink
- Report Inappropriate Content
You can either (1) create two expressions using set analysis to select the max year (2016) in one and max year - 1 in the other, or (2) you can make year a second dimension. This assumes that the dimension is some smaller period than a year (quarter, month or week).
Post a sample qvw with your expression for more specific help.
- Mark as New
- Bookmark
- Subscribe
- Mute
- Subscribe to RSS Feed
- Permalink
- Report Inappropriate Content
As u said that line chart shows only 2016 data,
does it means that in the expression you have hard coded year value to 2016 or is this some different case.
Please clarify.