Unlock a world of possibilities! Login now and discover the exclusive benefits awaiting you.
- Qlik Community
- :
- All Forums
- :
- QlikView App Dev
- :
- Re: change the font color - values on data points ...
- Subscribe to RSS Feed
- Mark Topic as New
- Mark Topic as Read
- Float this Topic for Current User
- Bookmark
- Subscribe
- Mute
- Printer Friendly Page
- Mark as New
- Bookmark
- Subscribe
- Mute
- Subscribe to RSS Feed
- Permalink
- Report Inappropriate Content
change the font color - values on data points not a line
I have an expression in my chart that is just values on data chart, but I'd like the change the color of it and add it to the legend. Nothing seems to be working.
- « Previous Replies
-
- 1
- 2
- Next Replies »
- Mark as New
- Bookmark
- Subscribe
- Mute
- Subscribe to RSS Feed
- Permalink
- Report Inappropriate Content
I am not able to get you ,
what do you want to change color of bars?
- Mark as New
- Bookmark
- Subscribe
- Mute
- Subscribe to RSS Feed
- Permalink
- Report Inappropriate Content
Hi parian17,
You should have more than 1 dimension OR more than 1 expression to show up in the legend.
The colors in the legend will be picked up from the colors of the expression.
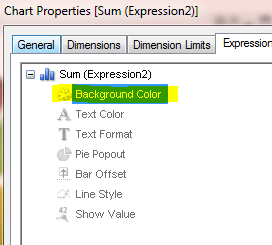
Best is change the color of the expression as shown below.
Hope this helps.
Thanks,
Robinson
- Mark as New
- Bookmark
- Subscribe
- Mute
- Subscribe to RSS Feed
- Permalink
- Report Inappropriate Content
No, not the color of the bars, the text color of the data point that are on top the of bars. I have an expressions with just "Values of Data Points" checked. and nothing else. Seems to respond to changes to the axis (not desired).
- Mark as New
- Bookmark
- Subscribe
- Mute
- Subscribe to RSS Feed
- Permalink
- Report Inappropriate Content
Hi parian17,
To change the color of the text on data points you need to change the text color in the expression.
See the attached file. Hope it helps you.
Regards
- Mark as New
- Bookmark
- Subscribe
- Mute
- Subscribe to RSS Feed
- Permalink
- Report Inappropriate Content
Sorry for not being clear. I'm not asking for the data points assosiated with the bar charts whatsoever. I have a seperate expression from the bar chart that plots its values above the bar chart, but again no association to the bar chart. I have an expression where the only thing checked is "Values on Data Points". Sorry for the confusion.
- Mark as New
- Bookmark
- Subscribe
- Mute
- Subscribe to RSS Feed
- Permalink
- Report Inappropriate Content
It seems that the color will change when you go into Chart Properties->Axes and choose (for me) the top most bar chart in the list, then click Font->Color... the problem with this is that it is also changing the y-axis font color as well as the data points font color. Still looking for a way to change just the data point font color.
- Mark as New
- Bookmark
- Subscribe
- Mute
- Subscribe to RSS Feed
- Permalink
- Report Inappropriate Content
Hi guys,
same problem here but little bit tricky.
In the selection pane i have filed "Number" contains values 1 to 10.
I have a bar chart with the same dimension as "Number".
Now if i select a single value from the "Number" filed then in my Bar chart I want to see that particular dimension value(font) in different colour and remaining dimension values should be white or hidden.
Thanks In Advance,
Naresh
- Mark as New
- Bookmark
- Subscribe
- Mute
- Subscribe to RSS Feed
- Permalink
- Report Inappropriate Content
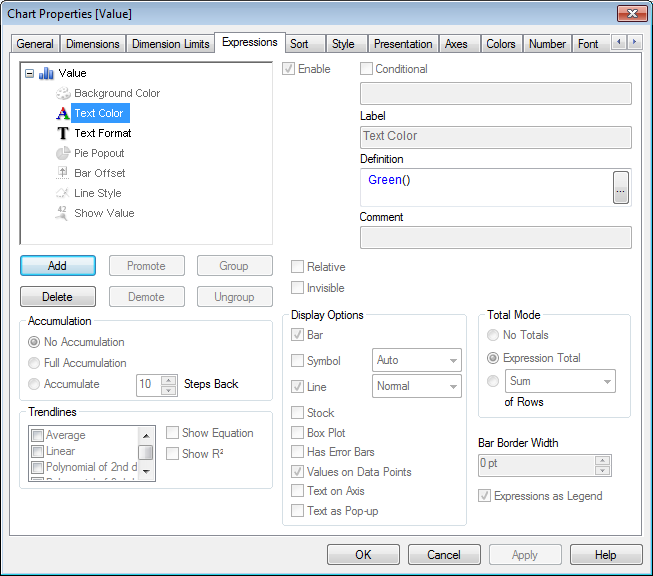
This thread is so old that this may not be relevant, but I had the same problem and I just figured out that from the 'Expression' tab, if you update the 'Text Color' with your conditional 'IF' statement including the RGB colors on both the expression used for the "Values on Data Point" as well as including the conditional statement in the 'Text Color' for the "main" line graph expression it works! Update the 'Text Color' for both (all) expressions.
- Mark as New
- Bookmark
- Subscribe
- Mute
- Subscribe to RSS Feed
- Permalink
- Report Inappropriate Content
Hi Josh,
Could you please help me with the codes on conditional IF statement for changing the text color, would be grateful if you could give me step-by-step method as I'm new to QlikView.
Awaiting with anticipation.
Best Regards,
Tony
- « Previous Replies
-
- 1
- 2
- Next Replies »