Unlock a world of possibilities! Login now and discover the exclusive benefits awaiting you.
- Qlik Community
- :
- All Forums
- :
- QlikView App Dev
- :
- Re: Value inside bar chart
- Subscribe to RSS Feed
- Mark Topic as New
- Mark Topic as Read
- Float this Topic for Current User
- Bookmark
- Subscribe
- Mute
- Printer Friendly Page
- Mark as New
- Bookmark
- Subscribe
- Mute
- Subscribe to RSS Feed
- Permalink
- Report Inappropriate Content
Value inside bar chart
Hi,
If have a bar chart in Qlikview which on the x axis shows months and the bars display actual sales and a bar estimated sales. I have the showing values switched off for the estimated sales. I only want to show these values if the month is in the future, this I achieved with the formula:
=If(sum({<Version = {'Actual'}>)[ExpenseAmount}, 1, 0).
This will show the value ON TOP off the bar, but I want to have the value INSIDE the bar. In presentation the box for showing values inside is checked, I also tried to change the numbers in the formula above but that didn't helped.
Can someone help me with this?
Thanks a lot!
Kind regards,
Paul
I attached a print screen off the chart
- « Previous Replies
-
- 1
- 2
- Next Replies »
- Mark as New
- Bookmark
- Subscribe
- Mute
- Subscribe to RSS Feed
- Permalink
- Report Inappropriate Content
Try this: Chart Properties > Presentation > Check 'Plot Values Inside Segments'.
Works for me.
All the best,
Matt - Visual Analytlcs Ltd
- Mark as New
- Bookmark
- Subscribe
- Mute
- Subscribe to RSS Feed
- Permalink
- Report Inappropriate Content
use below property
chart properties-> expression -> value on data point-> presentation -> check verticle and
also check Plot values inside Segments
hope this help
- Mark as New
- Bookmark
- Subscribe
- Mute
- Subscribe to RSS Feed
- Permalink
- Report Inappropriate Content
The Plot values inside segments box is already checked. But somehow with the expression attached to the showing value this doesn't work, therefor I was looking for other ideas.
- Mark as New
- Bookmark
- Subscribe
- Mute
- Subscribe to RSS Feed
- Permalink
- Report Inappropriate Content
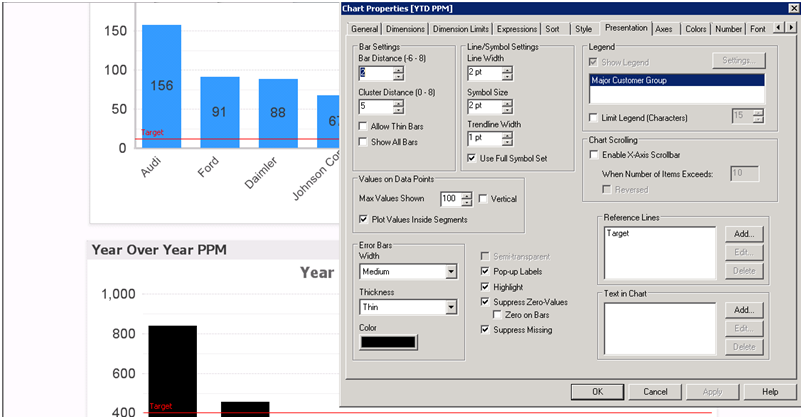
The Verticle box function seems to be disabled when you use a grouped bar chart. If you've selected a grouped bar chart look or similar under 'Chart Properties -> Style -> Look'. You need to consider one of the other options and then go to Chart Properties->Presentation->Values on Data Points and select the Verticle check box. This of course after activating Values on Data Points under Expressions in the Chart properties.
- Mark as New
- Bookmark
- Subscribe
- Mute
- Subscribe to RSS Feed
- Permalink
- Report Inappropriate Content
Hi Paul,
Please see below:
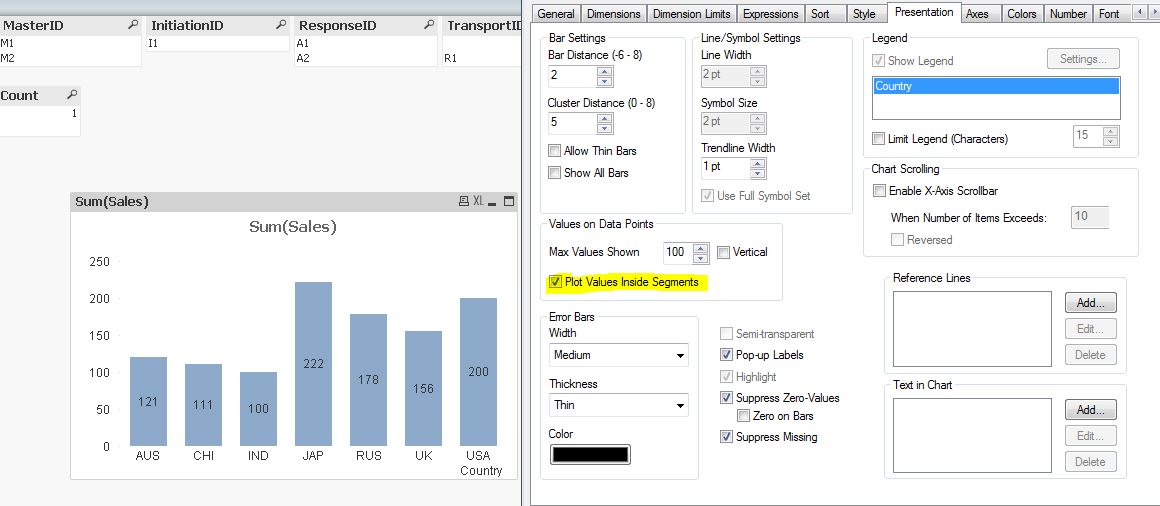
Go to Presentation tab->enable Plot Values Inside Segments and you will get value like in image below.
Thanks,
AS
- Mark as New
- Bookmark
- Subscribe
- Mute
- Subscribe to RSS Feed
- Permalink
- Report Inappropriate Content
I had the same problem of the value not showing even though the box was ticked.
It seemed to only show when the expression for which I wanted the value to show, was promoted to the top of the list of expressions (so it is the first one).
Not sure if this is a bug, but it worked for me. Good luck.
- Mark as New
- Bookmark
- Subscribe
- Mute
- Subscribe to RSS Feed
- Permalink
- Report Inappropriate Content
Hi,
Try this,
- Chart Properties
- Expressions Tab > in Display Options Section > Check Values on Data Points - so that the values are displayed
- to have the values inside the bar Horizontally : Presentation tab > Under Values on Data Points Section > Check Plot Values inside Segments and set Max Values Shown as 100.
- To have the values inside the bar Vertically : Presentation tab > Under Values on Data Points Section > Check Plot Values inside Segments & Vertical and set Max Values Shown as 100.
This will work now
Regards,
Aswinkumar B
- Mark as New
- Bookmark
- Subscribe
- Mute
- Subscribe to RSS Feed
- Permalink
- Report Inappropriate Content
good tip thanks sir!
- Mark as New
- Bookmark
- Subscribe
- Mute
- Subscribe to RSS Feed
- Permalink
- Report Inappropriate Content
Hi,
I have done the small example in that you can see I take dimension as Country and Expression as Sum of sales.
You can show the values on the bar chart as well as the inside the bar chart.
Please find the attached screen shot for your reference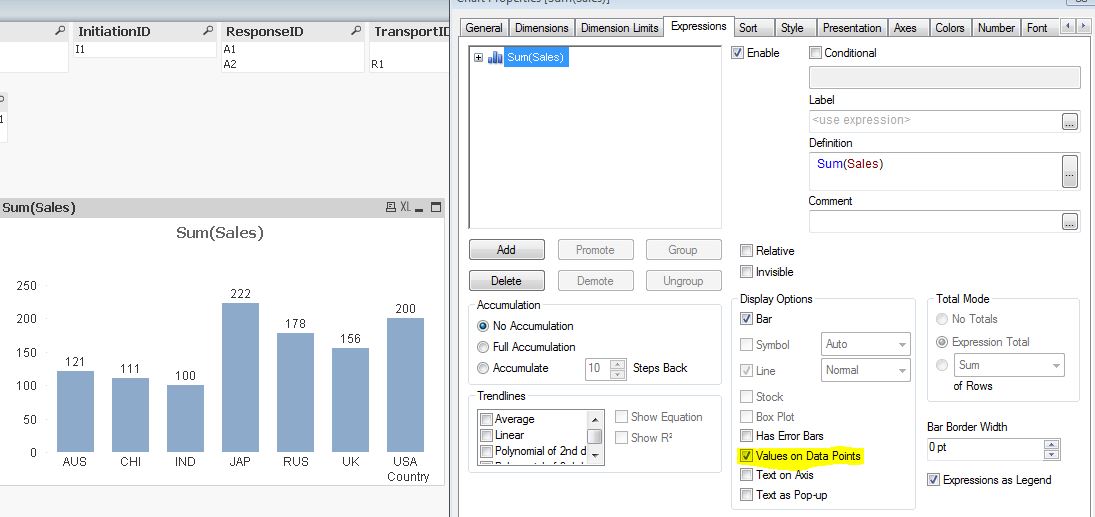
Regards,
Yogesh J
- « Previous Replies
-
- 1
- 2
- Next Replies »