Unlock a world of possibilities! Login now and discover the exclusive benefits awaiting you.
- Qlik Community
- :
- All Forums
- :
- QlikView App Dev
- :
- Re: Previous period Value
- Subscribe to RSS Feed
- Mark Topic as New
- Mark Topic as Read
- Float this Topic for Current User
- Bookmark
- Subscribe
- Mute
- Printer Friendly Page
- Mark as New
- Bookmark
- Subscribe
- Mute
- Subscribe to RSS Feed
- Permalink
- Report Inappropriate Content
Previous period Value
Hi, I'm trying to get the previous value in a straight table.
I've already checked solution with BELOW(), but it requires users sorting table by date and it's doesn't fit, for us.
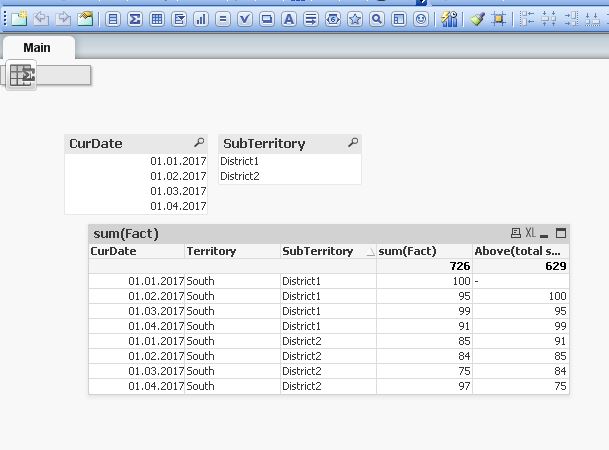
Here is the table example:
| Territory | SubTerritory | CurDate | Fact | Expected |
| South | District1 | 01.01.2017 | 100 | - |
| South | District1 | 01.02.2017 | 95 | 100 |
| South | District1 | 01.03.2017 | 99 | 95 |
| South | District1 | 01.04.2017 | 91 | 99 |
| South | District2 | 01.01.2017 | 85 | 91 |
| South | District2 | 01.02.2017 | 84 | 85 |
| South | District2 | 01.03.2017 | 75 | 84 |
| South | District2 | 01.04.2017 | 97 | 75 |
So, if somebody could help I really appreciate.
Thanks in advance, Andrey
- Mark as New
- Bookmark
- Subscribe
- Mute
- Subscribe to RSS Feed
- Permalink
- Report Inappropriate Content
HI,
Try to use like below,
Above(total sum(Fact))
- Mark as New
- Bookmark
- Subscribe
- Mute
- Subscribe to RSS Feed
- Permalink
- Report Inappropriate Content
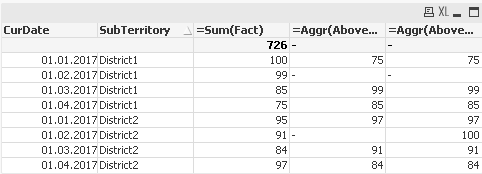
You can try this
=Aggr(Above(Sum(Fact)), Territory, SubTerritory, CurDate)
or this
=Aggr(Above(TOTAL Sum(Fact)), Territory, SubTerritory, CurDate)
As long as your load order for CurDate is ascending, this should work for you.
- Mark as New
- Bookmark
- Subscribe
- Mute
- Subscribe to RSS Feed
- Permalink
- Report Inappropriate Content
Sunny, Hi!
Yes, BELOW() works fine if data is ordered by asc.
But if I change load order in script, then it doesn't work, even if I make Load Order by CurDate in script.
That's why I don't want to use BELOW().
Maybe ! there is more basic solution for previous period value, than using BELOW()?
- Mark as New
- Bookmark
- Subscribe
- Mute
- Subscribe to RSS Feed
- Permalink
- Report Inappropriate Content
Hi, Devarasu!
Yes, BELOW() works fine if data is ordered by asc.
But if I change load order in script, then it doesn't work, even if I make Load Order by CurDate in script.
Maybe there is more basic solution for previous period value, than using BELOW()?
- Mark as New
- Bookmark
- Subscribe
- Mute
- Subscribe to RSS Feed
- Permalink
- Report Inappropriate Content
The Best way I can think of is when you use set analysis. This would solve the issues you would come across later stages in building your app.
- Mark as New
- Bookmark
- Subscribe
- Mute
- Subscribe to RSS Feed
- Permalink
- Report Inappropriate Content
I've tried this way, but get stucked with issue:
if I add field 'CurDate' to Dimensions, each row in table became looks like this:
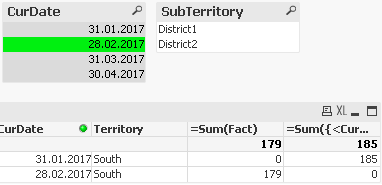
Do you have any ideas how to solve it?
- Mark as New
- Bookmark
- Subscribe
- Mute
- Subscribe to RSS Feed
- Permalink
- Report Inappropriate Content
This might be the best way to do it