Unlock a world of possibilities! Login now and discover the exclusive benefits awaiting you.
- Qlik Community
- :
- All Forums
- :
- QlikView App Dev
- :
- Percentage calculation in Pie chart with Trellis a...
- Subscribe to RSS Feed
- Mark Topic as New
- Mark Topic as Read
- Float this Topic for Current User
- Bookmark
- Subscribe
- Mute
- Printer Friendly Page
- Mark as New
- Bookmark
- Subscribe
- Mute
- Subscribe to RSS Feed
- Permalink
- Report Inappropriate Content
Percentage calculation in Pie chart with Trellis and ValueList
Hello,
I have to use ValueList in my chart to create Dimensions dynamically. And I was planning to create a chart with Trellis to show the customer a scrollable list of charts for several options.
The count for each Option in the chart works fine, but I have a problem with Percentages (I have both Count and % expressions set as "Related"). The total Percentage values for each Option is 25%, not 100%.
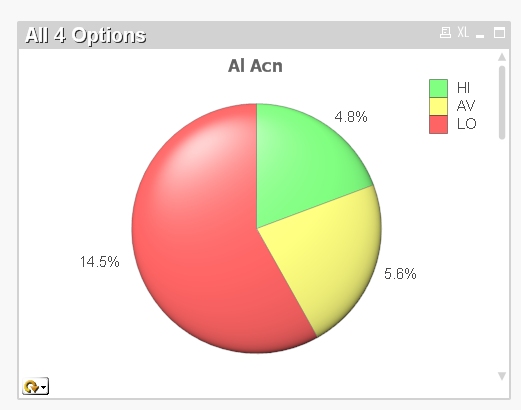
I have 4 Options (4 values in ValueList Synthetic Dimension) present, which explains 25%, but I am puzzling how to make all charts to show 100% for each pie chart displayed.
This is the example for only one Option avaialble:
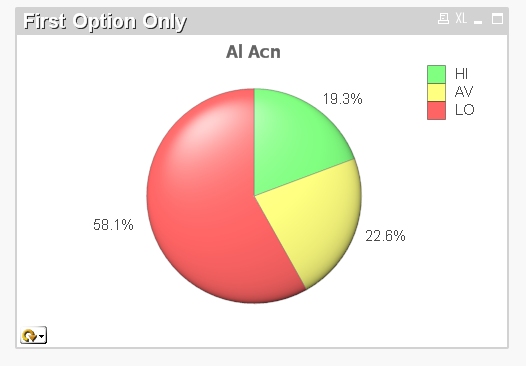
Any suggestions how this could be done?
My application is attached.
P.S. Another "minor" issue: the total percentage value in the case above is not 25%, but 24.9%. Any ideas why QV is not doing the rounding properly?
Best regards,
Vladimir
- Tags:
- trellis
- valuelist()
Accepted Solutions
- Mark as New
- Bookmark
- Subscribe
- Mute
- Subscribe to RSS Feed
- Permalink
- Report Inappropriate Content
Hi Vladimir,
explicitely calculating the percentages seems to work for me, please see attached.
And I also think this will help with your your sum-of-percentages-issue (as best as it can, how do you want to display three equal size pie pieces of 33.3333..% as integers?)
Regards,
Stefan
- Mark as New
- Bookmark
- Subscribe
- Mute
- Subscribe to RSS Feed
- Permalink
- Report Inappropriate Content
Hi.
I think you could solve it by refusing the 'Relative' option with Trellis and calculating the desired Percentage explicitly.
As for 'minor issue', it seems QV rounds them mathematically right. Sooth to say QV calculates percentage precisely well, then you choose the number format so text representation is rounded mathematically.
- Mark as New
- Bookmark
- Subscribe
- Mute
- Subscribe to RSS Feed
- Permalink
- Report Inappropriate Content
Actually, it was the first thing I've tried, but the result is the same:
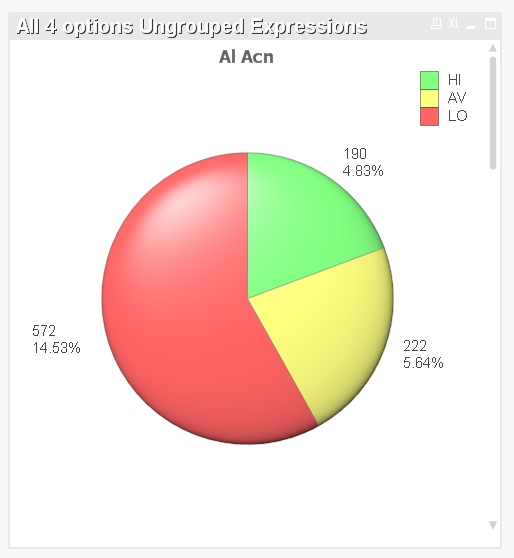
And about rounding: Yes, it adds together correctly if I increase the number of decimals (see above), but seems not be working OK if I select the "no decimals" for perscentage values display:
I am not sure how it qualifies as a "mathematically right" way. BTW, Excel calculates percentages perfectly with the same data.
- Mark as New
- Bookmark
- Subscribe
- Mute
- Subscribe to RSS Feed
- Permalink
- Report Inappropriate Content
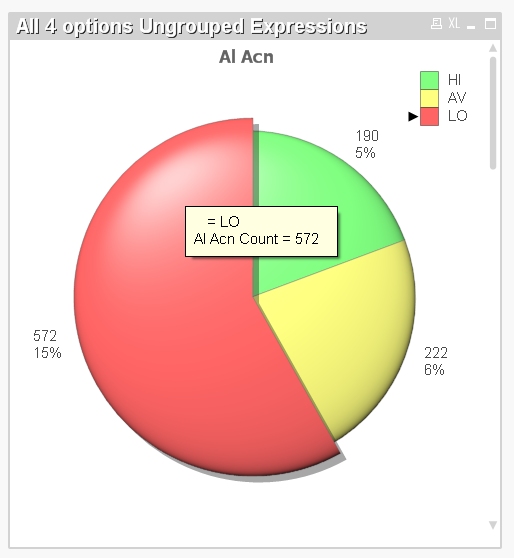
Clarification:
Even with two decimals total for ALL Options is not equal 100%:
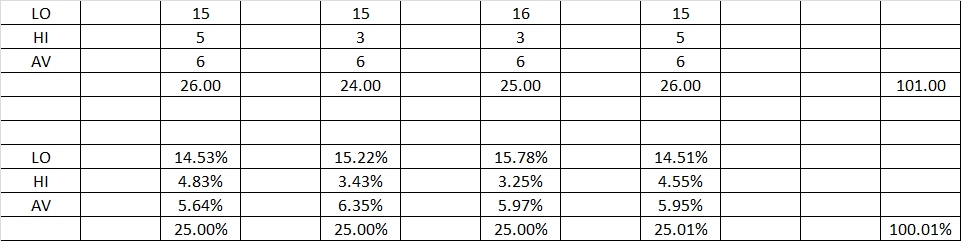
And the values are way off when percentages are displayed as Integers. I might have a problem explaining these numbers to my client.
🙂
- Mark as New
- Bookmark
- Subscribe
- Mute
- Subscribe to RSS Feed
- Permalink
- Report Inappropriate Content
Hi Vladimir,
explicitely calculating the percentages seems to work for me, please see attached.
And I also think this will help with your your sum-of-percentages-issue (as best as it can, how do you want to display three equal size pie pieces of 33.3333..% as integers?)
Regards,
Stefan
- Mark as New
- Bookmark
- Subscribe
- Mute
- Subscribe to RSS Feed
- Permalink
- Report Inappropriate Content
Great solution, Stefan!
I was hoping that I've missed something simple.
Thanks!
And to continue numbers discussion:
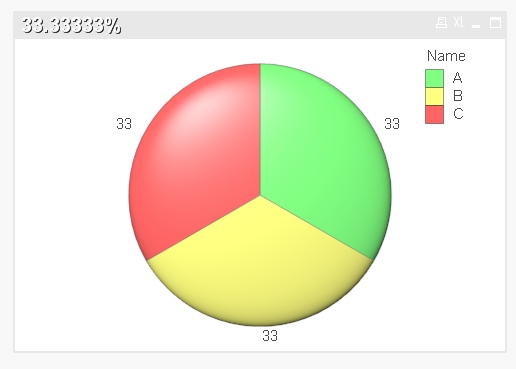
Here how QV and Excel interpret the same set of data: (3 slices for 33.3333333% each):
QV:
Excel:
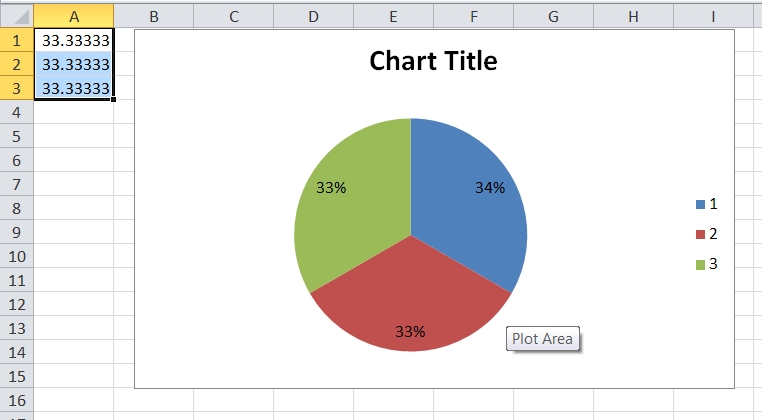
To be precise, I've entered values not as 33.33 but as 100/3.
I still think Excel's approach is more accurate.
Thanks again, for your suggestion!
Best regards,
Vladimir
- Mark as New
- Bookmark
- Subscribe
- Mute
- Subscribe to RSS Feed
- Permalink
- Report Inappropriate Content
[In my Excel 2007, I can't reproduce that Excel displays as you've shown, but maybe I am missing a format option]
IMHO, the above way excel shows the numbers implies that blue is bigger than the others, which is absolutely not the case.
And 33% is the correct approximation to 1/3 when displayed with no decimals, isn't it?
So I think it's a matter of showing the total right, or the single numbers (as right as a rounded number can be).
I am personally more interested in a comparison of the single numbers.