Unlock a world of possibilities! Login now and discover the exclusive benefits awaiting you.
Announcements
YOUR OPINION MATTERS! Please take the Qlik Experience survey you received via email. Survey ends June 14.
- Qlik Community
- :
- All Forums
- :
- QlikView App Dev
- :
- Re: Multiple Pie Charts
Options
- Subscribe to RSS Feed
- Mark Topic as New
- Mark Topic as Read
- Float this Topic for Current User
- Bookmark
- Subscribe
- Mute
- Printer Friendly Page
Turn on suggestions
Auto-suggest helps you quickly narrow down your search results by suggesting possible matches as you type.
Showing results for
Creator II
2014-07-24
11:26 AM
- Mark as New
- Bookmark
- Subscribe
- Mute
- Subscribe to RSS Feed
- Permalink
- Report Inappropriate Content
Multiple Pie Charts
Hi,
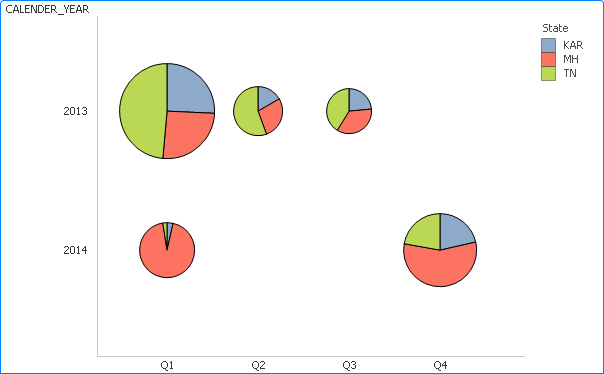
How do we display multiple Pie Charts ? Like the one in the file attached.
- Tags:
- new_to_qlikview
2,025 Views
1 Solution
Accepted Solutions
Partner - Creator II
2014-07-24
07:58 PM
- Mark as New
- Bookmark
- Subscribe
- Mute
- Subscribe to RSS Feed
- Permalink
- Report Inappropriate Content
Or, set up a Grid Chart. You'll need 3 dimensions (Quarter, Year, State), and one expression.
Hope this helps!
1,831 Views
5 Replies
MVP
2014-07-24
11:31 AM
- Mark as New
- Bookmark
- Subscribe
- Mute
- Subscribe to RSS Feed
- Permalink
- Report Inappropriate Content
Go to dimension tab and select trellis button
Tick Enable Trellis chart
Creator II
2014-07-24
12:25 PM
Author
- Mark as New
- Bookmark
- Subscribe
- Mute
- Subscribe to RSS Feed
- Permalink
- Report Inappropriate Content
Alright got it ! Thanks so much Manish Kachhia 
1,831 Views
Partner - Creator II
2014-07-24
07:58 PM
- Mark as New
- Bookmark
- Subscribe
- Mute
- Subscribe to RSS Feed
- Permalink
- Report Inappropriate Content
Or, set up a Grid Chart. You'll need 3 dimensions (Quarter, Year, State), and one expression.
Hope this helps!
1,832 Views
Creator II
2014-07-25
12:59 AM
Author
- Mark as New
- Bookmark
- Subscribe
- Mute
- Subscribe to RSS Feed
- Permalink
- Report Inappropriate Content
Great, this also displays the dimensions. Thank you Angel Monjaras.
1,831 Views
Partner - Creator II
2014-07-25
11:21 AM
- Mark as New
- Bookmark
- Subscribe
- Mute
- Subscribe to RSS Feed
- Permalink
- Report Inappropriate Content
Glad to help!