Unlock a world of possibilities! Login now and discover the exclusive benefits awaiting you.
- Qlik Community
- :
- All Forums
- :
- QlikView App Dev
- :
- Re: Help on Grid Chart
- Subscribe to RSS Feed
- Mark Topic as New
- Mark Topic as Read
- Float this Topic for Current User
- Bookmark
- Subscribe
- Mute
- Printer Friendly Page
- Mark as New
- Bookmark
- Subscribe
- Mute
- Subscribe to RSS Feed
- Permalink
- Report Inappropriate Content
Help on Grid Chart
Hi Team,
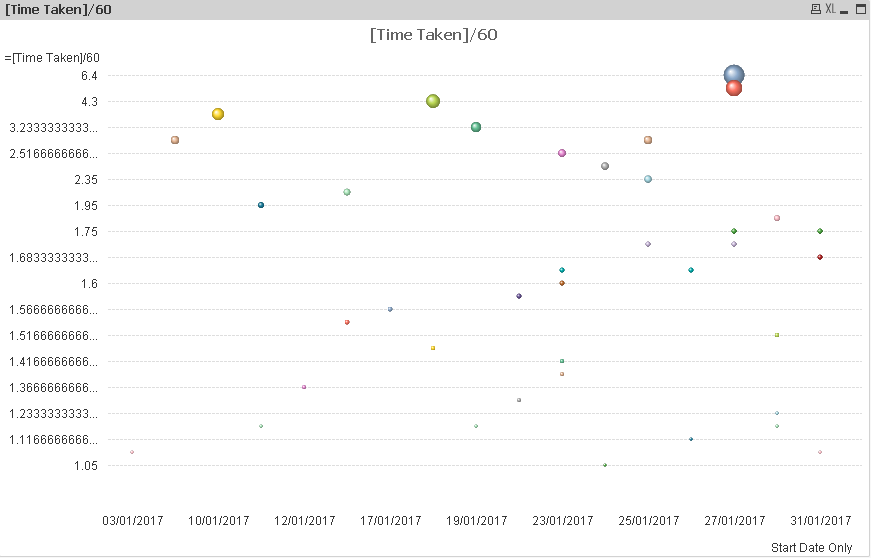
When I am using the Grid chart, below is what I am getting which needs few modifications:
1) Y-axis (time) should be in integers only (no decimals)
2) the size of all doubles should be same
3) color of each doubles to be same (if possible)
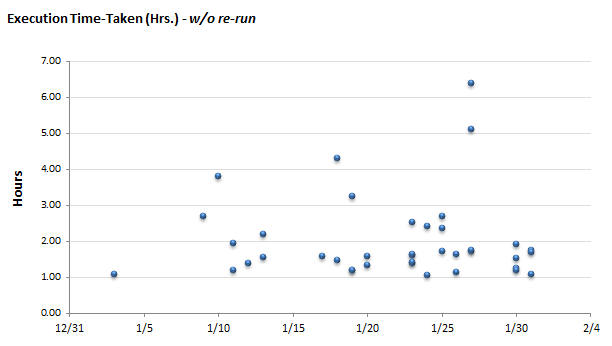
Below is something which I am looking for:
- « Previous Replies
-
- 1
- 2
- Next Replies »
- Mark as New
- Bookmark
- Subscribe
- Mute
- Subscribe to RSS Feed
- Permalink
- Report Inappropriate Content
Hi Antonio,
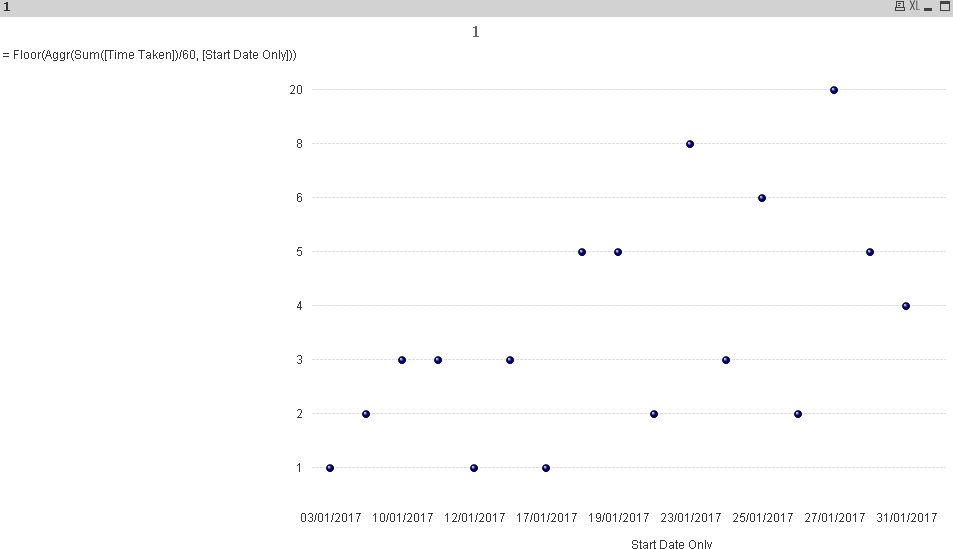
Your solution puts the bubble at the integer y axis level.
For example if the value is 1.5, i want the bubble to be in between 1 and 2. But your solution will put that at either 1 or 2, but not in between.
See output of above:
- Mark as New
- Bookmark
- Subscribe
- Mute
- Subscribe to RSS Feed
- Permalink
- Report Inappropriate Content
Try
=Floor([Time Taken]/60,0.5)
- Mark as New
- Bookmark
- Subscribe
- Mute
- Subscribe to RSS Feed
- Permalink
- Report Inappropriate Content
Hi Antonio,
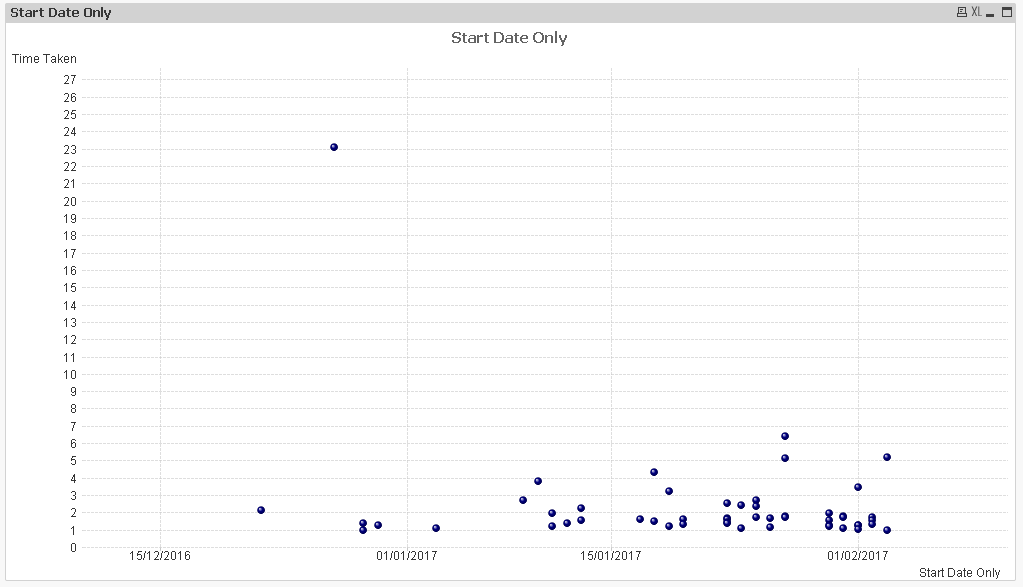
This will just show 1, 1.5, 2, 2.5 in the y-axis.
My requirement is to show only 1,2, 3 .. in y axis and to plot the dots in between if it falls.
Something like below:

- Mark as New
- Bookmark
- Subscribe
- Mute
- Subscribe to RSS Feed
- Permalink
- Report Inappropriate Content
Hi Adam,
Can you please suggest how I can display only unique values in y axis and also to display the doubles at original positions and not floor-ed them up to nearest integer.
Thanks
- Mark as New
- Bookmark
- Subscribe
- Mute
- Subscribe to RSS Feed
- Permalink
- Report Inappropriate Content
Hi,
I would mess with the 'static step' option on the axis tab to get what you want,
let me just play with your app a moment
- Mark as New
- Bookmark
- Subscribe
- Mute
- Subscribe to RSS Feed
- Permalink
- Report Inappropriate Content
- « Previous Replies
-
- 1
- 2
- Next Replies »