Unlock a world of possibilities! Login now and discover the exclusive benefits awaiting you.
- Qlik Community
- :
- All Forums
- :
- QlikView App Dev
- :
- Re: Help Using Rank Function
- Subscribe to RSS Feed
- Mark Topic as New
- Mark Topic as Read
- Float this Topic for Current User
- Bookmark
- Subscribe
- Mute
- Printer Friendly Page
- Mark as New
- Bookmark
- Subscribe
- Mute
- Subscribe to RSS Feed
- Permalink
- Report Inappropriate Content
Help Using Rank Function
Hi,
Can someone help me using Rank function, i have this example but the output is not what i expected :
=aggr(if(rank(
Sum({<
DataType = {'Outsort'}
, YearMonth = {$(=Max(YearMonth))}
, ItemType = {'12'}
, Range = {'XXX'}
>} [Scrapped quantity])
+
Sum({<
DataType = {'Outsort'}
, YearMonth = {$(=Max(YearMonth))}
, ItemType = {'12'}
, Range = {'XXX'}
>} [Sent to Repair quantity])
,4)=1,
Sum({<
DataType = {'Outsort'}
, YearMonth = {$(=Max(YearMonth))}
, ItemType = {'12'}
, Range = {'XXX'}
>} [Scrapped quantity])
+
Sum({<
DataType = {'Outsort'}
, YearMonth = {$(=Max(YearMonth))}
, ItemType = {'12'}
, Range = {'XXX}
>} [Sent to Repair quantity])),[Scrap description])
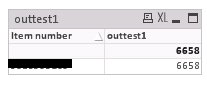
Using this expression i intend to get the quantities of every item with Scrap Description Rank 1, and it actually returns the sum of the total quantity :
But what i want is to list them by item like this :
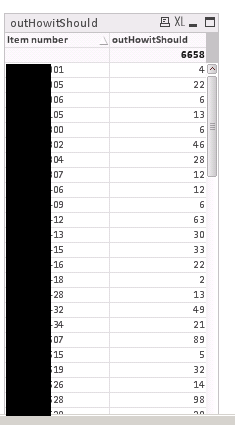
Anyone knows how to solve this ?
- « Previous Replies
-
- 1
- 2
- Next Replies »
- Mark as New
- Bookmark
- Subscribe
- Mute
- Subscribe to RSS Feed
- Permalink
- Report Inappropriate Content
Are we trying to fix the bottom three charts on the top chart?
- Mark as New
- Bookmark
- Subscribe
- Mute
- Subscribe to RSS Feed
- Permalink
- Report Inappropriate Content
Yes, thats the point, Link the bottom charts to show detailed ItemNr Information for each of the defects visible on the Top Chart 
- Mark as New
- Bookmark
- Subscribe
- Mute
- Subscribe to RSS Feed
- Permalink
- Report Inappropriate Content
But isn't that what we are currently seeing? You want this to be dynamic? Meaning if you had 10 different defects on the top chart... you would want to see 10 charts below with top 2 items under each defect?
- Mark as New
- Bookmark
- Subscribe
- Mute
- Subscribe to RSS Feed
- Permalink
- Report Inappropriate Content
Yes, i want it to be dynamic, in the case the Top Chart will always show for example the top 5 defects for the day, but i have a lot of possible defects so the top 5 will probably change everyday, what i need is that the bottom charts always show the information according the top chart
- Mark as New
- Bookmark
- Subscribe
- Mute
- Subscribe to RSS Feed
- Permalink
- Report Inappropriate Content
So, in your sample... if top chart shows top 2 defects (Broken and Fail)... we would want two charts at the bottom to do the same, right? (let's remove the third chart)
For bottom chart 1... expression
Sum({<Date = {'20180806'}, Defect = {"=Rank(Sum({<Date = {'20180806'}>}QTY)) = 1"}>}QTY)
For bottom chart 2... expression
Sum({<Date = {'20180806'}, Defect = {"=Rank(Sum({<Date = {'20180806'}>}QTY)) = 2"}>}QTY)
You can do the same thing for the next 3 charts....
- Mark as New
- Bookmark
- Subscribe
- Mute
- Subscribe to RSS Feed
- Permalink
- Report Inappropriate Content
Thanks stalwar1,
This works like a charm ...
Had to modify a little for the original report (mostly in the set analisys for the rank sum) but just perfect ...
Thanks
- « Previous Replies
-
- 1
- 2
- Next Replies »