Unlock a world of possibilities! Login now and discover the exclusive benefits awaiting you.
- Qlik Community
- :
- All Forums
- :
- QlikView App Dev
- :
- Re: BG Color
- Subscribe to RSS Feed
- Mark Topic as New
- Mark Topic as Read
- Float this Topic for Current User
- Bookmark
- Subscribe
- Mute
- Printer Friendly Page
- Mark as New
- Bookmark
- Subscribe
- Mute
- Subscribe to RSS Feed
- Permalink
- Report Inappropriate Content
BG Color
Hi all,
i m trying to achieve for color coding for my expression using my three fields value, i tried a lot but no luck.
can any one tell me how to achieve this.
Note : In Green, Yellow and Red those values may change in future. i want to make it dynamic.
Thankq in adv.
- « Previous Replies
-
- 1
- 2
- Next Replies »
Accepted Solutions
- Mark as New
- Bookmark
- Subscribe
- Mute
- Subscribe to RSS Feed
- Permalink
- Report Inappropriate Content
Hi,
I worked with your data and found some work around it.
check it out whether it matches your requirement. !
Script:
Final:
LOAD *,
if(Green_Flag=0,Right(Green_Range,2),Green_Range) as G,
if(Yellow_Flag=0,Right(Yellow_Range,2),Yellow_Range) as Y,
if(Red_Flag=0,Right(Red_Range,2),Red_Range) as R;
LOAD*,
If(WildMatch(Green_Range,'*.*'),1,0) as Green_Flag,
If(WildMatch(Yellow_Range,'*.*'),1,0) as Yellow_Flag,
If(WildMatch(Red_Range,'*.*'),1,0) as Red_Flag;
Data:
LOAD KPI,
[Metric Unit],
Goal,
Green,
If(Len(KeepChar(Green,'.0123456789'))>3,Left(KeepChar(Green,'.0123456789'),4),KeepChar(Green,'.0123456789')) as Green_Range,
If(Len(KeepChar(Yellow,'.0123456789'))>3,Left(KeepChar(Yellow,'.0123456789'),4),KeepChar(Yellow,'.0123456789')) as Yellow_Range,
If(Len(KeepChar(Red,'.0123456789'))>3,Left(KeepChar(Red,'.0123456789'),4),KeepChar(Red,'.0123456789')) as Red_Range,
Yellow,
Red,
[Sum(Week_Actuals)] as Val
FROM
(biff, embedded labels, table is Sheet1$);
-Nagarjun
- Mark as New
- Bookmark
- Subscribe
- Mute
- Subscribe to RSS Feed
- Permalink
- Report Inappropriate Content
Check this, Change accordingly as per your need
- Mark as New
- Bookmark
- Subscribe
- Mute
- Subscribe to RSS Feed
- Permalink
- Report Inappropriate Content
this is not correct anil,
in my requirement each KPI is having difference range and that range is also not fixed it may change in future.
- Mark as New
- Bookmark
- Subscribe
- Mute
- Subscribe to RSS Feed
- Permalink
- Report Inappropriate Content
Then you must talk about Business and requirement. You are releasing any thing to do. If you release few key words which is relevant to the Business then we may help you for sure
- Mark as New
- Bookmark
- Subscribe
- Mute
- Subscribe to RSS Feed
- Permalink
- Report Inappropriate Content
May be this when you talk about Dynamic. Even i am not sure whether you are expecting same. But check may be helps you
- Mark as New
- Bookmark
- Subscribe
- Mute
- Subscribe to RSS Feed
- Permalink
- Report Inappropriate Content
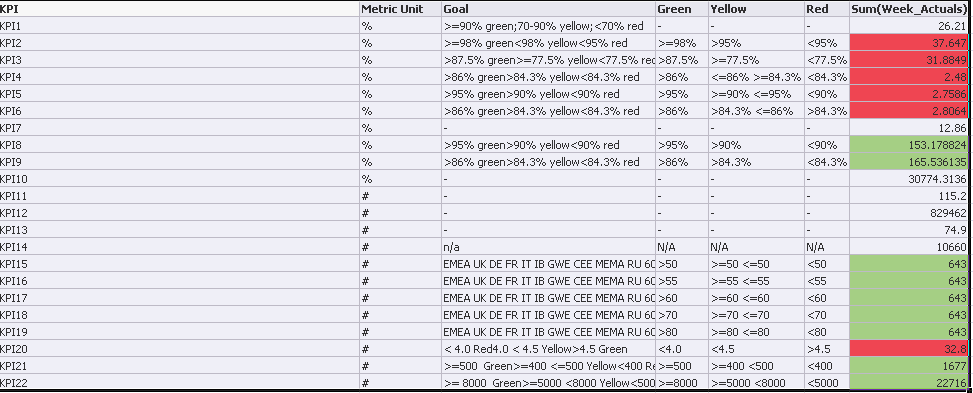
As per my requirement My output should be like below:
- Mark as New
- Bookmark
- Subscribe
- Mute
- Subscribe to RSS Feed
- Permalink
- Report Inappropriate Content
Here you have create some variables and same value you are passing to all KPI's but If you check my data you see Each KPI Color range is different and dont not hard code those values.
Instead of entering hard code values can we get those value from Green , Yellow red for each KPI wise.?
- Mark as New
- Bookmark
- Subscribe
- Mute
- Subscribe to RSS Feed
- Permalink
- Report Inappropriate Content
Ok, We can achieve same but do you have only 22 KPI's or mostly these KPI's or constant or it's changes when filter Happens. But, I wonder with out Hard code for Green, Yellow, red fields how can we achieve. Let me think play around and please confirm whether KPI are constant or not, If it constant i may help you (P.S - Constant means only 21 KPI's are there or it may increased?)
- Mark as New
- Bookmark
- Subscribe
- Mute
- Subscribe to RSS Feed
- Permalink
- Report Inappropriate Content
Its constant
- Mark as New
- Bookmark
- Subscribe
- Mute
- Subscribe to RSS Feed
- Permalink
- Report Inappropriate Content
Then try like below for BG expression
=If(KPI='KPI1' and [Sum(Week_Actuals)] < 0,If(Green > '>=90%', Green(), If(Yellow >= '>=70%' and Yellow <= '<=90%', Yellow(), If(Red < '<70%', Red()))),
If(KPI='KPI2',If(Green > '>=98%', Green(), If(Yellow < '<98%', Yellow(), If(Red < '<95%', Red()))),
If(KPI='KPI3',If(Green > '>87.5%', Green(), If(Yellow >= '>=77.5%', Yellow(), If(Red < '<77.5%', Red()))),
If(KPI='KPI4',If(Green > '>86%', Green(), If(Yellow > '>84.3%', Yellow(), If(Red > '<84.3%', Red()))
)))))
Or
=If(KPI='KPI1' and [Sum(Week_Actuals)] < 0,If(Green = '>=90%', Green(), If(Yellow = '>=70%' and Yellow = '<=90%', Yellow(), If(Red = '<70%', Red()))),
If(KPI='KPI2',If(Green = '>=98%', Green(), If(Yellow = '<98%', Yellow(), If(Red = '<95%', Red()))),
If(KPI='KPI3',If(Green = '>87.5%', Green(), If(Yellow = '>=77.5%', Yellow(), If(Red = '<77.5%', Red()))),
If(KPI='KPI4',If(Green = '>86%', Green(), If(Yellow = '>84.3%', Yellow(), If(Red = '<84.3%', Red()))
)))))
And similar to till KPI22. There must be good approach as i know this one is simply when constant for the object. May be marcowedel cleveranjos marcus_sommer cal help us
- « Previous Replies
-
- 1
- 2
- Next Replies »