Unlock a world of possibilities! Login now and discover the exclusive benefits awaiting you.
- Qlik Community
- :
- All Forums
- :
- QlikView Administration
- :
- Re: Cumulative Line Chart - Number of QlikView Use...
- Subscribe to RSS Feed
- Mark Topic as New
- Mark Topic as Read
- Float this Topic for Current User
- Bookmark
- Subscribe
- Mute
- Printer Friendly Page
- Mark as New
- Bookmark
- Subscribe
- Mute
- Subscribe to RSS Feed
- Permalink
- Report Inappropriate Content
Cumulative Line Chart - Number of QlikView Users by Date - QV Server Monitor
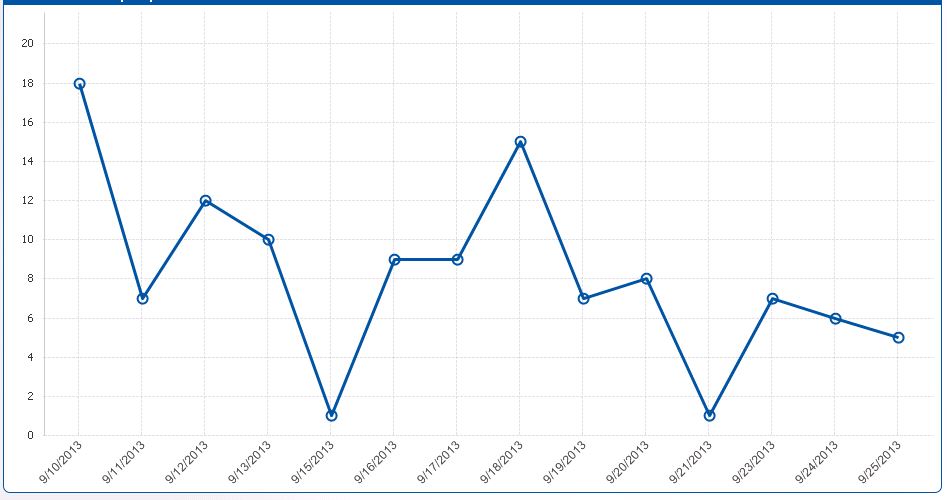
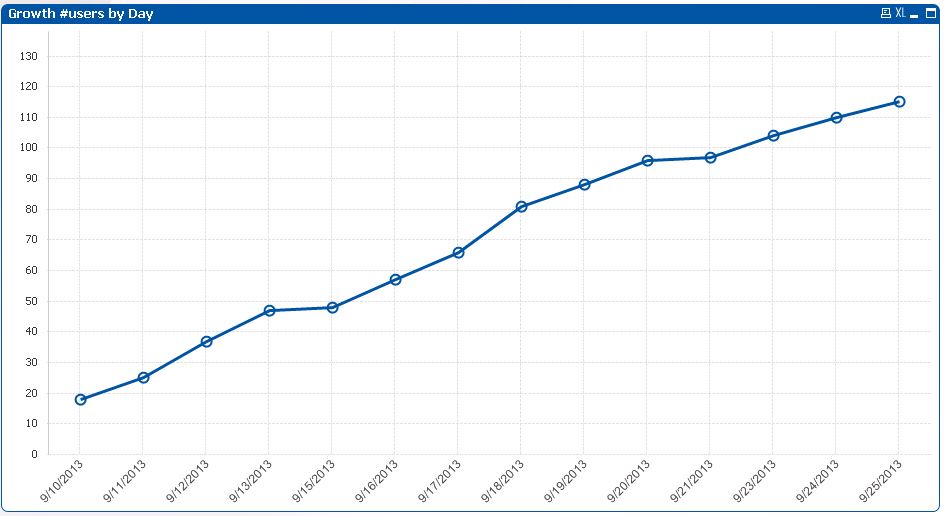
There is a line chart in QV server monitor for number of QlikView users by day (screenshot named 'existing' attached). It gives number of users that logged on to QlikView at any given day. I want it to tweak it a little bit so that it shows total number of unique users till any particular day, something that look like screenshot attached "wanted". The expression used in the chart in server monitor is 'Count(Distinct [UserCountField])' and dimension is 'Date'. Is there any way to do this so that We can track growth in number of users? Thanks for helping.
- Mark as New
- Bookmark
- Subscribe
- Mute
- Subscribe to RSS Feed
- Permalink
- Report Inappropriate Content
In "Expressions" sheet, on the object Properties, you have the option to Acumulate the Expression.
Hope it helps.
- Mark as New
- Bookmark
- Subscribe
- Mute
- Subscribe to RSS Feed
- Permalink
- Report Inappropriate Content
Yes but in that case I don't get desired result. For example suppose the senerio below:
Day Unique users existed Total users browsed QV
1 15 15
2 20 10 (5 new users started to use QV on this day, 15 to 20)
3 20 18 (no new users started to use QV, 20 no change)
4 23 15 (3 new users started to use QV, 20 to 23)
5 23 20 (no new users started to use 23 no change)
Right now I am having the report by Day & Total users browsed QV. If I use cumm function as you said, What I get is
Day Total users browsed QV
1 15
2 15+10
3 15+10+18
4 15+10+18+15
5 15+10+18+15+20
This is not what I want. I want to see how users are growing, something like this below:
Day Unique users existed
1 15
2 20
3 20
4 23
5 23
This is to know how the number of folks to browsed qlikview is growing. Any suggestions?
- Mark as New
- Bookmark
- Subscribe
- Mute
- Subscribe to RSS Feed
- Permalink
- Report Inappropriate Content
Hi Siddharth, did you get the answers for this? I have the same scenario....
- Mark as New
- Bookmark
- Subscribe
- Mute
- Subscribe to RSS Feed
- Permalink
- Report Inappropriate Content
Hi,
you can do this by using rank function and rangesum. I had a similar scenario that I had to deal with today and I fixed it using the aboved mentioned function.