Unlock a world of possibilities! Login now and discover the exclusive benefits awaiting you.
- Subscribe to RSS Feed
- Mark as New
- Mark as Read
- Bookmark
- Subscribe
- Printer Friendly Page
- Report Inappropriate Content
The biggest tournament in soccer is in full swing today, and if you haven't checked out our Choose Your Champion demo app, take a second to check it out now Choose Your Champion. We've gotten some questions about how we built it, so I'm going to go through a high-level summary. Before we begin, note that there's really two parts of the Choose Your Champion app, the Create a Bracket part, and the Historical Analysis part, which we really took two different approaches for.
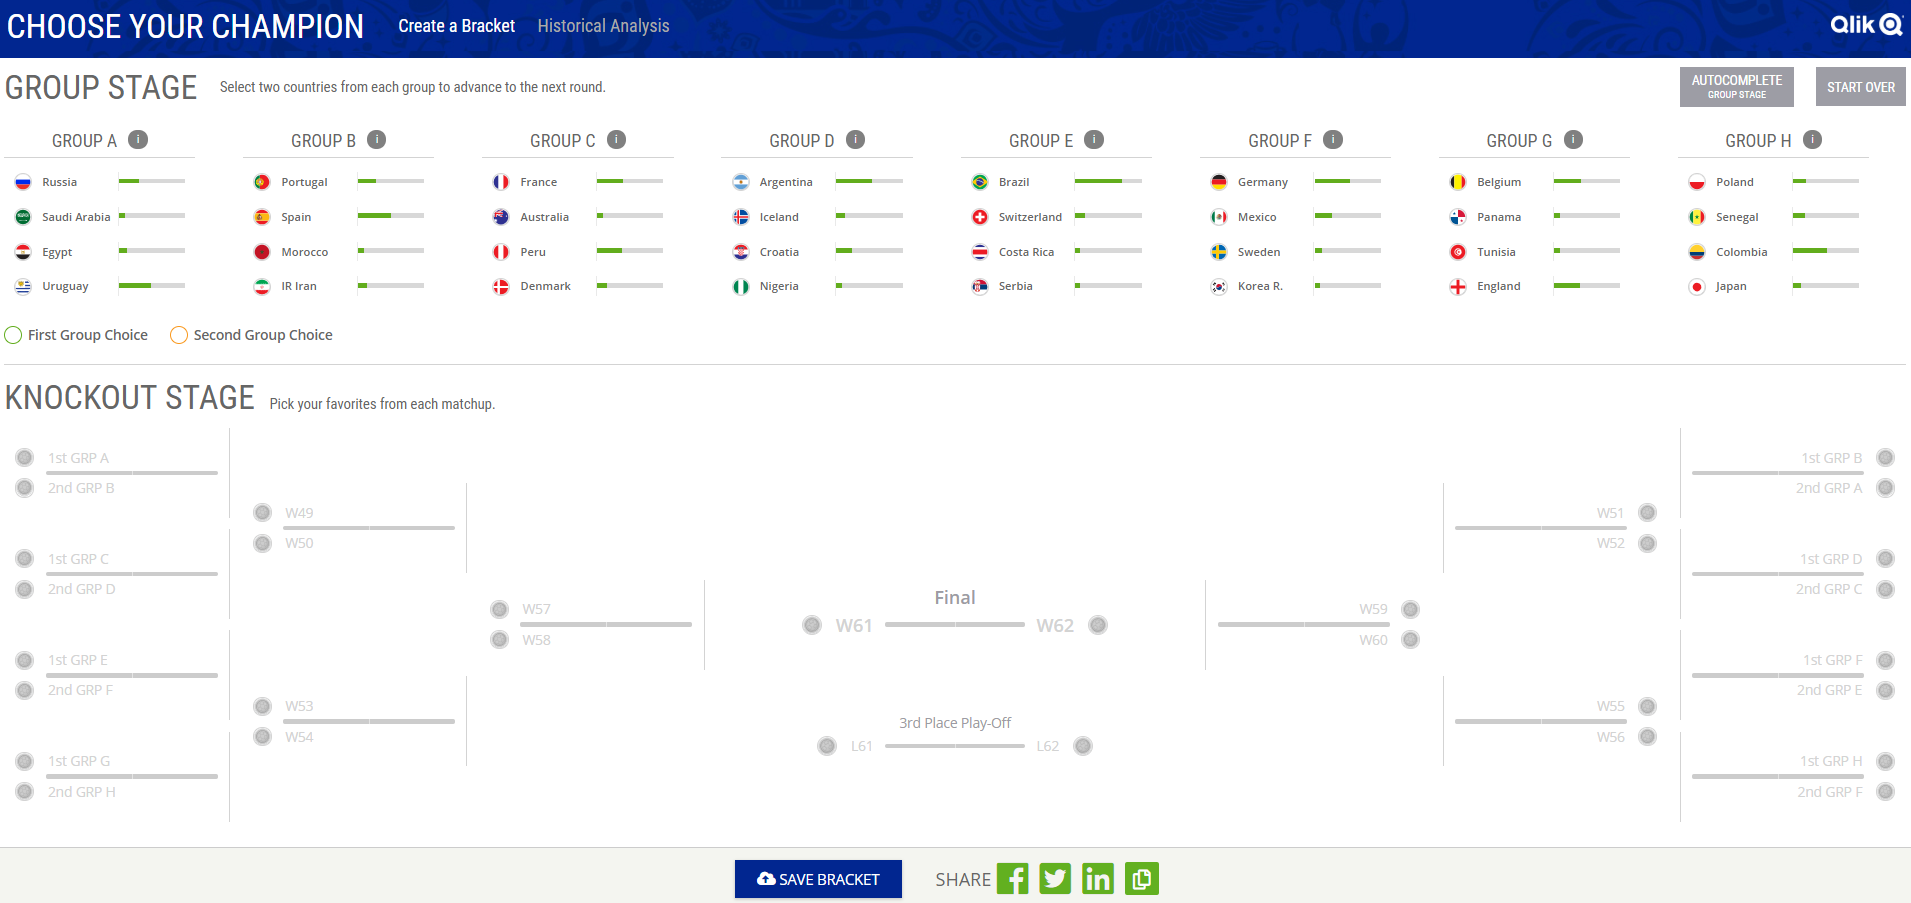
Create a Bracket
For the “Create a Bracket” half of the Choose Your Champion app, we connect to a Qlik Sense app with enigma.js on page load. We get all the data we need from Qlik Sense using Qlik expressions and pagination to select from the associated data, which is fast and easy. The data we get from Qlik Sense we then put into a Redux store, and manage state from there. We decided this was the best approach for this part of the app for us for quite a few reasons, but it would be pretty trivial to have Qlik Sense manage all the state here if desired with a few Qlik Sense variables and a bit of set analysis.
Once we have the data from Qlik Sense saved in a Redux store, we just use html, css, and javascript to build the bracket and charts. Any selections the user makes just updates the Redux store. The charts here really are very simple, just some divs with conditional widths/heights. We allow the user to authenticate with Facebook and save their bracket, which we just save to a database, and fallback to localstorage to save the state if the user isn’t authenticated or hasn’t yet saved a bracket.
And this really demonstrates the power and flexibility of Qlik Sense APIs. We can easily get the data we need, and then do whatever we’d like with it.
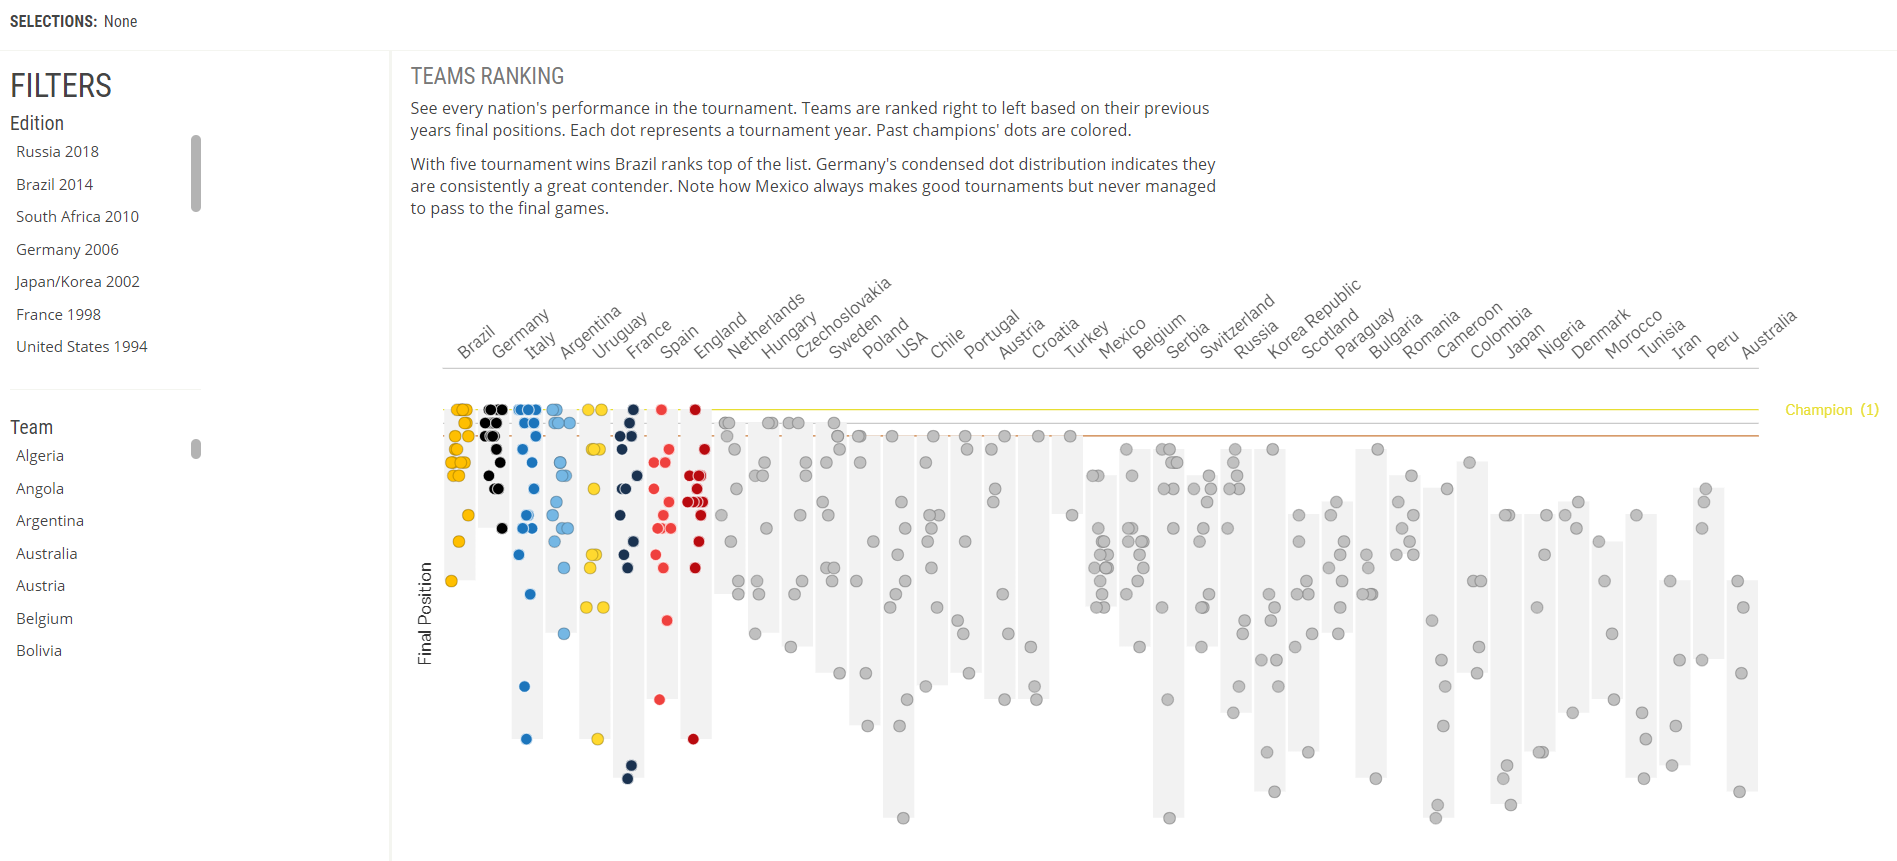 Historical Analysis
The “Historical Analysis” half of the Choose Your Champion app is probably a more familiar Qlik Sense experience. We connect to the app using our qdt-components library so we have access to our prebuilt QdtSelectionToolbar component and then also built a custom filter and table component (fun fact: the bar chart is also the custom table component, with a few special props). We also connect to the Visualization API using qdt-components to create and embed some native Qlik Sense visualizations.
That’s really it, this part of the app is pretty straightforward.
A few comments
Somebody had asked if the custom visualizations were extensions, and the answer is no, there are no extensions used here. While Qlik Sense extensions are great if you want to reuse them across multiple apps, or enable non-developers to create the objects in the Qlik Sense client, if you don’t have those requirements it’s easier to just build some components that interface with the Qlik Sense engine but don’t have to worry about being extensions. This also means those components can be used in other projects where you may not be connecting to the Visualization API and you won’t have to load all of the assets required to use the Visualization API.
And that’s it. Like I already stated, I think this demo shows the power and flexibility of the Qlik Sense APIs and what is possible with them, and I hope there’s something to take away for everyone here. If you guys have any questions about any of it, let me know.
You must be a registered user to add a comment. If you've already registered, sign in. Otherwise, register and sign in.