Unlock a world of possibilities! Login now and discover the exclusive benefits awaiting you.
- Qlik Community
- :
- All Forums
- :
- QlikView App Dev
- :
- show total (bar chart) in the presentation tab but...
- Subscribe to RSS Feed
- Mark Topic as New
- Mark Topic as Read
- Float this Topic for Current User
- Bookmark
- Subscribe
- Mute
- Printer Friendly Page
- Mark as New
- Bookmark
- Subscribe
- Mute
- Subscribe to RSS Feed
- Permalink
- Report Inappropriate Content
show total (bar chart) in the presentation tab but with an exception :)
hi Guys,
Please have a look at my bar chart :). As you can see I added a bar in mspaint and named this bar 'netPerformance'  .
.
The 'netPerformance' bar is the count of all the shipments that are: 'ontime', 'sync', 'embargo airlines', 'ell', 'consol sea'. All these names are from 1 dimension: "DelayCode".
My expression is: count(Order) which is set to relative.
I have been able to get a the nettPerformance in a gauge chart by using the expression below:
count(if(Match(DelayCode, 'ELL', 'CONSOL', 'CONSOL SEA','EMBARGO AIRLINES', 'SASO', 'SYNC', 'OnTime'),Order)) / Count(Order)
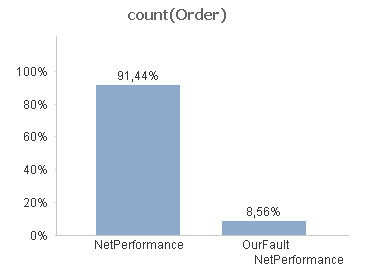
Now I'm trying to create a similar bar chart like the screenshot where I have an extra bar that basically count all the delay's, except for 'our fault', and present it in one bar chart. If I select show total in the presentation tab it give me the total percentage of 100%. I don't want the total, but the total minus 'our fault', which should result in a performance of '91,44'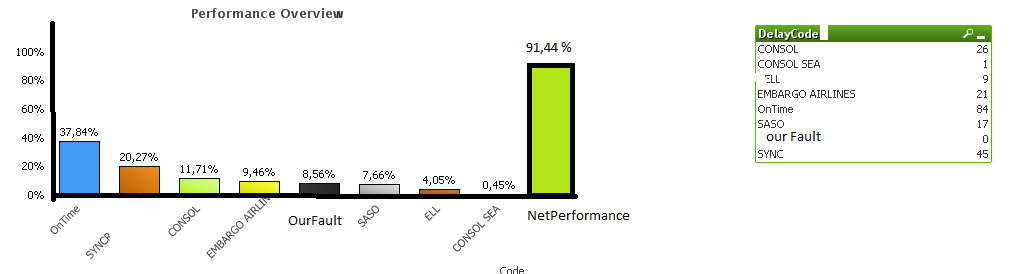
Hope some one can help me out or point me to the right direction.
Cheers!
iSam
Accepted Solutions
- Mark as New
- Bookmark
- Subscribe
- Mute
- Subscribe to RSS Feed
- Permalink
- Report Inappropriate Content
Yes,
I disabled the second expression. Then I needed to enable show total bar in presentation tab and added a minus sign before the equal sign in the set expression
.. {<DelayCode -= {'OurFault'}>}
I think that's all that was needed,
Stefan
- Mark as New
- Bookmark
- Subscribe
- Mute
- Subscribe to RSS Feed
- Permalink
- Report Inappropriate Content
Is there way that I can perphans group all the codes, except 'our fault', into one field (NetPerformance)
I tried this:
IF(DelayCode='', 'NetPerformance',
IF(DelayCode='CONSOL SEA', 'NetPerformance',
IF(DelayCode='ELL', 'NetPerformance',
IF(DelayCode='SASO', 'NetPerformance',
IF(DelayCode='CONSOL', 'NetPerformance',
IF(DelayCode='EMBARGO AIRLINES', 'NetPerformance',
IF(DelayCode='SYNC', 'NetPerformance',
IF(DelayCode='company', 'OurFault',)))))))) as NetPerformance,
Hope some some can help 
Too bad I can't just cut and past the "NetPerformance" into the previous bar chart.
- Mark as New
- Bookmark
- Subscribe
- Mute
- Subscribe to RSS Feed
- Permalink
- Report Inappropriate Content
iSam,
for your first question, I think it could work like this:
- uncheck "relative" in expression tab
- as expression use
=if(Dimensionality(),count(Order)/count(total Order), count({<Order -= {'our Fault'}>} Order) / count(Order) )
So you use different expressions depending on if the expression is evaluated on total row or as a line with dimension.
Hope this helps,
Stefan
- Mark as New
- Bookmark
- Subscribe
- Mute
- Subscribe to RSS Feed
- Permalink
- Report Inappropriate Content
Hi Stefan,
I tried your expression and changed the Order to DelayCode:
if(Dimensionality(),count(Order)/count(total Order), count({<DelayCode= {'OurFault'}>} Order) / count(Order) )
I added an expression:
count({<DelayCode= {'OurFault'}>} Order) / count(Order) )
but that gave me a result of 100% 
I've attached my qlikview file. Hope u can find the error.
Thanks in advance for all your help!!!!!
iSam
- Mark as New
- Bookmark
- Subscribe
- Mute
- Subscribe to RSS Feed
- Permalink
- Report Inappropriate Content
Yes,
I disabled the second expression. Then I needed to enable show total bar in presentation tab and added a minus sign before the equal sign in the set expression
.. {<DelayCode -= {'OurFault'}>}
I think that's all that was needed,
Stefan
- Mark as New
- Bookmark
- Subscribe
- Mute
- Subscribe to RSS Feed
- Permalink
- Report Inappropriate Content
Thanks!! That indeed did the job!!! 
- Mark as New
- Bookmark
- Subscribe
- Mute
- Subscribe to RSS Feed
- Permalink
- Report Inappropriate Content
Hi Swuehl,
If two dimensions are there then what would be the output, Let's say you have to show month as first dimension and second will be delaycode.
Regards,
Ravi,