Unlock a world of possibilities! Login now and discover the exclusive benefits awaiting you.
- Qlik Community
- :
- All Forums
- :
- QlikView App Dev
- :
- Trellis chart and animate chart ...
- Subscribe to RSS Feed
- Mark Topic as New
- Mark Topic as Read
- Float this Topic for Current User
- Bookmark
- Subscribe
- Mute
- Printer Friendly Page
- Mark as New
- Bookmark
- Subscribe
- Mute
- Subscribe to RSS Feed
- Permalink
- Report Inappropriate Content
Trellis chart and animate chart ...
Hi All,
How to create trellis chart and animate chart ?
what is the functionality of this trellis chart and animate chart, please share the example.
Regards,
Raja.
Accepted Solutions
- Mark as New
- Bookmark
- Subscribe
- Mute
- Subscribe to RSS Feed
- Permalink
- Report Inappropriate Content
Hi Raja,
Trellis Chart:
A trellis chart is a grid of small charts. It is basically a repetition of a chart across a grid. Usually, at least two dimensions are used, one for the grid variable and another for the x-axis within each small chart.
With a trellis chart, you can, not only analyze the metrics within each chart without a query (a selection), but also look at the bigger picture and compare with the rest of the group at the same time. This way, you can easily identify the irregular behaviors among the variables.
This is because individual chart is sharing the same y-axis; therefore, you can accurately compare the metrics across the grid.
Animation in Charts:
Animation is only available for bitmap charts excluding pie charts. Some functionality limitations apply when using animation. For example, it is not possible to make painted or clicked selections in an animated chart. Trend lines will not be drawn in animated charts. Animation will only be possible when there are more than one possible values in the animation dimension.
When a chart is animated an Animation Bar will appear at the bottom of the chart plot area. The Animation bar features a Play button, which starts the animation. When the animation is running the Play button is replaced by a Pause button.
It is possible to stop or start the animation whenever you like using these controls. A Progress Bar shows the progress of the animation. It is possible to animate manually by pointing at the progress bar handle with the mouse, press down the left mouse button and drag to any position. Manual animation normally skips interpolated frames (see Frames per Second setting below) and moves only between actual values in the animation dimension. By pressing the Ctrl-key on the keyboard while dragging, it is possible to drag over interpolated frames. Above the progress bar the value of the animation dimension for the current frame (in case of interpolated frames the previous actual animation dimension value) will be shown.
Refer the above two posts by Nirmal Raj for example .
Regards.
Siva
- Mark as New
- Bookmark
- Subscribe
- Mute
- Subscribe to RSS Feed
- Permalink
- Report Inappropriate Content
Hi Raja
PFA
Hope this will helps you
- Mark as New
- Bookmark
- Subscribe
- Mute
- Subscribe to RSS Feed
- Permalink
- Report Inappropriate Content
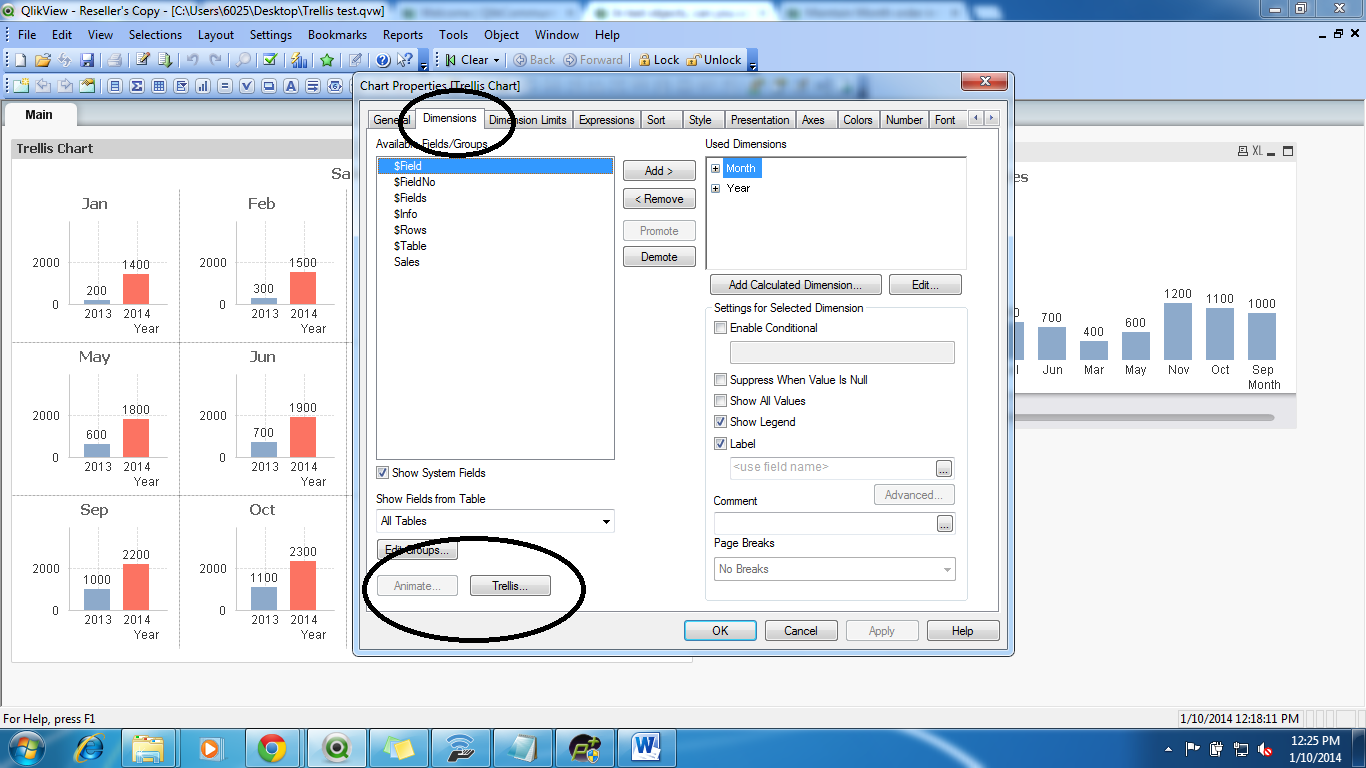
Hi
PF the image hope this image will give you an idea how to create the trellis and animate chart
- Mark as New
- Bookmark
- Subscribe
- Mute
- Subscribe to RSS Feed
- Permalink
- Report Inappropriate Content
Hi Raja,
Trellis Chart:
A trellis chart is a grid of small charts. It is basically a repetition of a chart across a grid. Usually, at least two dimensions are used, one for the grid variable and another for the x-axis within each small chart.
With a trellis chart, you can, not only analyze the metrics within each chart without a query (a selection), but also look at the bigger picture and compare with the rest of the group at the same time. This way, you can easily identify the irregular behaviors among the variables.
This is because individual chart is sharing the same y-axis; therefore, you can accurately compare the metrics across the grid.
Animation in Charts:
Animation is only available for bitmap charts excluding pie charts. Some functionality limitations apply when using animation. For example, it is not possible to make painted or clicked selections in an animated chart. Trend lines will not be drawn in animated charts. Animation will only be possible when there are more than one possible values in the animation dimension.
When a chart is animated an Animation Bar will appear at the bottom of the chart plot area. The Animation bar features a Play button, which starts the animation. When the animation is running the Play button is replaced by a Pause button.
It is possible to stop or start the animation whenever you like using these controls. A Progress Bar shows the progress of the animation. It is possible to animate manually by pointing at the progress bar handle with the mouse, press down the left mouse button and drag to any position. Manual animation normally skips interpolated frames (see Frames per Second setting below) and moves only between actual values in the animation dimension. By pressing the Ctrl-key on the keyboard while dragging, it is possible to drag over interpolated frames. Above the progress bar the value of the animation dimension for the current frame (in case of interpolated frames the previous actual animation dimension value) will be shown.
Refer the above two posts by Nirmal Raj for example .
Regards.
Siva