Unlock a world of possibilities! Login now and discover the exclusive benefits awaiting you.
- Qlik Community
- :
- All Forums
- :
- QlikView App Dev
- :
- Show accumulate in pivot table
- Subscribe to RSS Feed
- Mark Topic as New
- Mark Topic as Read
- Float this Topic for Current User
- Bookmark
- Subscribe
- Mute
- Printer Friendly Page
- Mark as New
- Bookmark
- Subscribe
- Mute
- Subscribe to RSS Feed
- Permalink
- Report Inappropriate Content
Show accumulate in pivot table
Hi community,
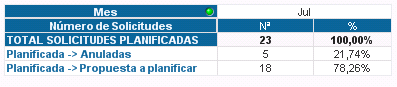
I have this table:
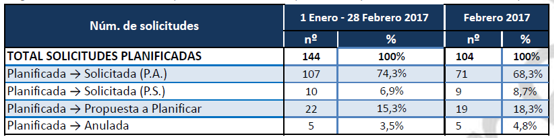
And I need show month and accumulate:
Any help, please?
Thanks.
- « Previous Replies
-
- 1
- 2
- Next Replies »
- Mark as New
- Bookmark
- Subscribe
- Mute
- Subscribe to RSS Feed
- Permalink
- Report Inappropriate Content
Also I want know if is possible apply the same style (each row of a color).
- Mark as New
- Bookmark
- Subscribe
- Mute
- Subscribe to RSS Feed
- Permalink
- Report Inappropriate Content
Hi,
Can you post some sample data,that will more helpful to find the solution.
Thanks,
Neha
- Mark as New
- Bookmark
- Subscribe
- Mute
- Subscribe to RSS Feed
- Permalink
- Report Inappropriate Content
It is possible, If you provide data.
Or simple create
Then create One Pivot Chart
Dimensions are --
[Numero Solictudos],
ValueList('1 enero - 18 Febero 2017','Febero 2017')
Then Call Two expressions by the Label of N2, % and then Drag ValueList dimension from vertical to horizontal in the top of the Pivot table. Then you will achieve it
Then call BG color to give automate color rows If(Mod(Rowno(),2)=1, White(), Blue())
Give as Dimension BG Color and then Same with 2 expressions.
And then Go to Presentation Tab --> Then Call Total as TOTAL SOLICITUDIES PLANIFICADAS
Good Luck , You will do it 
- Mark as New
- Bookmark
- Subscribe
- Mute
- Subscribe to RSS Feed
- Permalink
- Report Inappropriate Content
Attach a reduced exampled.
This is all that I can do it.
- Mark as New
- Bookmark
- Subscribe
- Mute
- Subscribe to RSS Feed
- Permalink
- Report Inappropriate Content
Attach a reduced example.
Thanks.
- Mark as New
- Bookmark
- Subscribe
- Mute
- Subscribe to RSS Feed
- Permalink
- Report Inappropriate Content
14 MB, I don't have access to download AON due to client location. So, here create sample inline memory and then tell us your expected output like above(Original message)
- Mark as New
- Bookmark
- Subscribe
- Mute
- Subscribe to RSS Feed
- Permalink
- Report Inappropriate Content
!Update.
I got a table with accumulate, but in some month, not works correctly. Attach the reduced example, when you can see in 'Mar' month that not accumulate (loses data). In a simple table can see that data that I lose is repeated data.
Thanks for the help.
Regards.
- Mark as New
- Bookmark
- Subscribe
- Mute
- Subscribe to RSS Feed
- Permalink
- Report Inappropriate Content
What is wrong with the output you are seeing? Can you share the desired output for Mar?
- Mark as New
- Bookmark
- Subscribe
- Mute
- Subscribe to RSS Feed
- Permalink
- Report Inappropriate Content
Expected output of 3 first months (Bold -> accumulate)
January:
P.A. - 36 36
P.S. - 1 1
P.P. - 3 3
A - 0 0
TOTAL - 40 40
February:
P.A. - 71 107
P.S. - 9 10
P.P. - 19 22
A - 5 5
TOTAL - 104 144
Mar:
P.A. - 142 249
P.S. - 9 19
P.P. - 44 66
A - 14 19
TOTAL - 209 353
In this month loses data.
- « Previous Replies
-
- 1
- 2
- Next Replies »