Unlock a world of possibilities! Login now and discover the exclusive benefits awaiting you.
- Qlik Community
- :
- All Forums
- :
- QlikView App Dev
- :
- Set analysis issue with previous year
- Subscribe to RSS Feed
- Mark Topic as New
- Mark Topic as Read
- Float this Topic for Current User
- Bookmark
- Subscribe
- Mute
- Printer Friendly Page
- Mark as New
- Bookmark
- Subscribe
- Mute
- Subscribe to RSS Feed
- Permalink
- Report Inappropriate Content
Set analysis issue with previous year
Hi All,
I'm struggling with undesired behavior of set analysis...
The table shows Year of service date, while the sales are calculated based on sales date range.
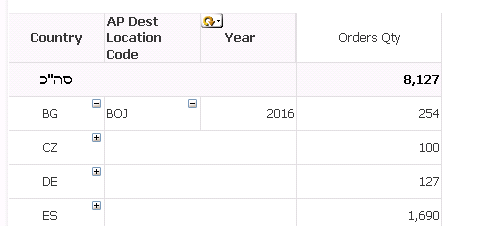
I added the following expression to calculate previous year sales,
Sum({<RsvLineCreateDate = {">=$(=vMinPrevYrResvDate)<=$(=vMaxPrevYrResvDate)"}>} [# of Seats/Rooms])
But this caused the previous service year to be displayed as well, which is not desired.
How can i control this?
Thanks!
- « Previous Replies
-
- 1
- 2
- Next Replies »
Accepted Solutions
- Mark as New
- Bookmark
- Subscribe
- Mute
- Subscribe to RSS Feed
- Permalink
- Report Inappropriate Content
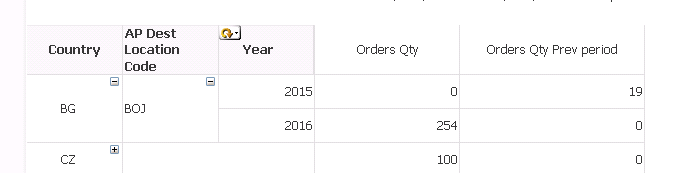
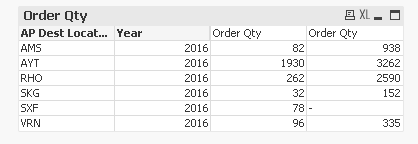
I have a question: in the document I see it differently than the screen capture you sent:
What version of QlikView are you using? This might be related to use of a old version of QlikView
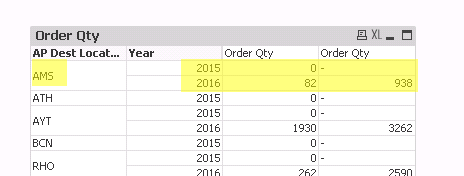
When i select 2016, It shows the previous Year 2015 too, and you don't see the quantity for that year.
So for AMS, it should have been 938, but it shows 0...
I would need to show the selected period only (i.e, 2016) and the previous year sum..
Is this feasible?
The fourth column you see in the table is the previous year. Isn't that what you were looking for? Current year and Previous year data next to each other?
- Mark as New
- Bookmark
- Subscribe
- Mute
- Subscribe to RSS Feed
- Permalink
- Report Inappropriate Content
Instead of Set Analysis you will need Above/Below function based on ascending/descending sorting  . I guess it would be easy to help if you cna share a sample with us
- Mark as New
- Bookmark
- Subscribe
- Mute
- Subscribe to RSS Feed
- Permalink
- Report Inappropriate Content
Hi,
Not sure i follow: assuming the user selected 2016. I want the table to display 2016, and show sales of 2015.
Would the Above function help?
Thanks!
- Mark as New
- Bookmark
- Subscribe
- Mute
- Subscribe to RSS Feed
- Permalink
- Report Inappropriate Content
Yes it definitely will. You will have to use some set analysis to restrict selections. The other way would be to use AsOfDate: The As-Of Table
- Mark as New
- Bookmark
- Subscribe
- Mute
- Subscribe to RSS Feed
- Permalink
- Report Inappropriate Content
Can you please explain why does the previous year date is displayed in the dimension column
after I add the expression?
Please note that it's not the sales date - it's a different date in the same record.
Thanks!
- Mark as New
- Bookmark
- Subscribe
- Mute
- Subscribe to RSS Feed
- Permalink
- Report Inappropriate Content
It would be much easier and faster to show you with an example of how this can be done. Would you be able to share few rows of data?
- Mark as New
- Bookmark
- Subscribe
- Mute
- Subscribe to RSS Feed
- Permalink
- Report Inappropriate Content
Here it is..
Hope it's enough..
Thanks!
- Mark as New
- Bookmark
- Subscribe
- Mute
- Subscribe to RSS Feed
- Permalink
- Report Inappropriate Content
I don't see a quantity field and country field. I think I am going to get a self created sample to demonstrate what I am trying to say and hopefully it will help you understand.
- Mark as New
- Bookmark
- Subscribe
- Mute
- Subscribe to RSS Feed
- Permalink
- Report Inappropriate Content
Hi,
The quantity is the count of Rsv No. (order id)
You can use the field AP Dest Location Code as a dimension for a city..
Thanks!
- Mark as New
- Bookmark
- Subscribe
- Mute
- Subscribe to RSS Feed
- Permalink
- Report Inappropriate Content
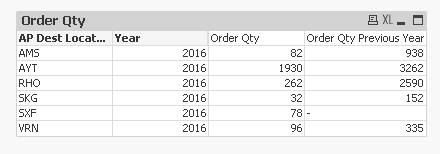
Can you check if this is what you want?
Expressions
1) =Count({<CreateYear = {$(=Max(CreateYear))}, Year, CreateDate, ServiceDate>}[Rsv No.])
2) =Above(Count({<CreateYear = {$(=Max(CreateYear)-1)}, Year, CreateDate, ServiceDate>}[Rsv No.]))
- « Previous Replies
-
- 1
- 2
- Next Replies »