Unlock a world of possibilities! Login now and discover the exclusive benefits awaiting you.
- Qlik Community
- :
- All Forums
- :
- QlikView App Dev
- :
- Positive representation
- Subscribe to RSS Feed
- Mark Topic as New
- Mark Topic as Read
- Float this Topic for Current User
- Bookmark
- Subscribe
- Mute
- Printer Friendly Page
- Mark as New
- Bookmark
- Subscribe
- Mute
- Subscribe to RSS Feed
- Permalink
- Report Inappropriate Content
Positive representation
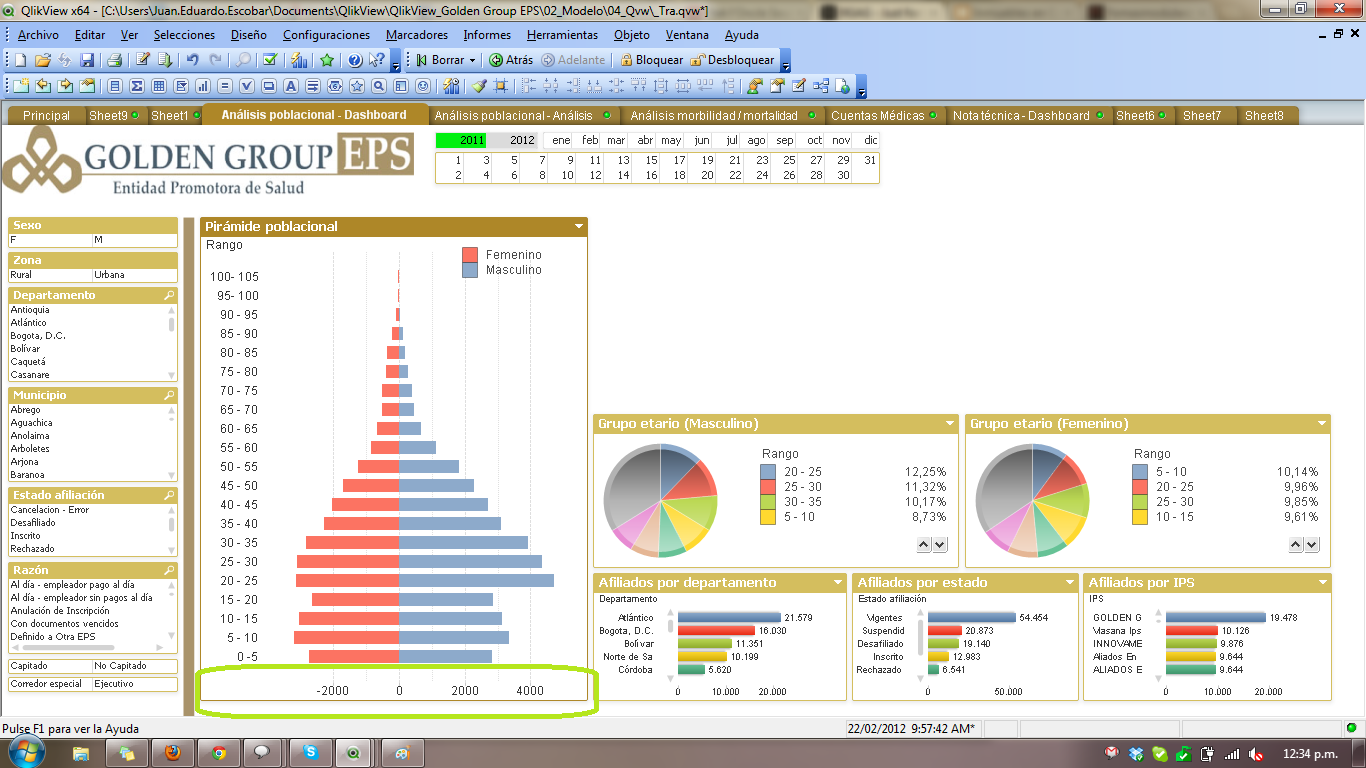
Hello, I have this model where I have this "piramidal" chart made of bars, ones positive and the others negative. I want to make that value positive in the X axe of the char.
Besides, i have this =IF(IsNUll(getfieldselections (Mes)),Date(Date#(Max(Mes),'MM'),'MM'),num(month(date#(getfieldselections (Mes),'MMM'))) ) to get the max month if there is no selection at all. Now, I want to insert that into this set analysis =Count(DISTINCT{$<[TipoFecha]={'Periodo'}, [Sexo]={M}>}[Identificación afiliado]), is used to draw one side of the barchart.
Making a long story short, I want to use that conditional in the set analysis so when I don't have anything selected, the chart can show me the max month
Thanks
- « Previous Replies
-
- 1
- 2
- Next Replies »
- Mark as New
- Bookmark
- Subscribe
- Mute
- Subscribe to RSS Feed
- Permalink
- Report Inappropriate Content
Juan,
talking about the bar chart, you want to create something like a butterfly chart, right?
This is not an easy task in QV, but maybe this gives you some ideas:
community.qlik.com/message/145421
Stefan
- Mark as New
- Bookmark
- Subscribe
- Mute
- Subscribe to RSS Feed
- Permalink
- Report Inappropriate Content
hi,
If you want to select by default Month, if there is no selection then you can try the below code.
Count(DISTINCT{$<[TipoFecha]={'Periodo'}, [Sexo]={M},Year={$(=Max(Year))},Month={$(=Max(Month))}>}[Identificación afiliado])
Deepak
- Mark as New
- Bookmark
- Subscribe
- Mute
- Subscribe to RSS Feed
- Permalink
- Report Inappropriate Content
I wans't able to use that with my model, I don't know if I'm missing something or what. Is there any explanation more clear?
- Mark as New
- Bookmark
- Subscribe
- Mute
- Subscribe to RSS Feed
- Permalink
- Report Inappropriate Content
How should I use the Year={$(=Max(Year))}, Month={$(=Max(Month)), shoul I have them predefined?
- Mark as New
- Bookmark
- Subscribe
- Mute
- Subscribe to RSS Feed
- Permalink
- Report Inappropriate Content
hi,
Yes you need to have the Year(Date) as Year and num(Month(Date)) as Month in your a field in your Script
Deepak
- Mark as New
- Bookmark
- Subscribe
- Mute
- Subscribe to RSS Feed
- Permalink
- Report Inappropriate Content
ok, I've done that, but all the bars in the chart disappear.
I just need to have the max value of the month and year when there is nothing selected. I was trying with this expressions:
=IF(IsNUll(getfieldselections (Mes)),Date(Date#(Max(Mes),'MM'),'MM'),num(month(date#(getfieldselections (Mes),'MMM'))) ) for month (the variable is called mesFiltro)
=IF(IsNull(getfieldselections (Año)),Max(Año),getfieldselections (Año)) for year (the variable is called añoFiltro)
and then using them as variables, and in the chart expression using them as this:
=Count(DISTINCT{$<TipoFecha={'Periodo'}, [Sexo]={M}, Mes=mesFiltro, Año=añoFiltro>}[Identificación afiliado]) for the right side of the chart
=-Count(DISTINCT{$<TipoFecha={'Periodo'}, [Sexo]={F}>}[Identificación afiliado]) for the left side of the chart
too difficult?
- Mark as New
- Bookmark
- Subscribe
- Mute
- Subscribe to RSS Feed
- Permalink
- Report Inappropriate Content
hi,
Can you attach a sample file..
Deepak
- Mark as New
- Bookmark
- Subscribe
- Mute
- Subscribe to RSS Feed
- Permalink
- Report Inappropriate Content
It's kind of big the file, mmm and I have tried some thing in the scripts but no answer 
I attached it, finally.
- Mark as New
- Bookmark
- Subscribe
- Mute
- Subscribe to RSS Feed
- Permalink
- Report Inappropriate Content
hi,
I got your problem.. you can create a single Yearmonth variable.
If you are creating a single yearmonth variable then u need to have a yearmonth field in the script as
Year(TempDate) & num(Month(TempDate),'00') as YearMonth
variable will be as follows
vYearMonth = if(getselectedcount(Año) =0,Year(today())&num(month(today()),'00'),Max(YearMonth))
and use this variable in the expression
Count({$<YearMonth={$(vYearMonth)}>}[Identificación afiliado]))
I hope this solve your problem.
Deepak
- « Previous Replies
-
- 1
- 2
- Next Replies »