Unlock a world of possibilities! Login now and discover the exclusive benefits awaiting you.
- Qlik Community
- :
- All Forums
- :
- QlikView App Dev
- :
- Numeric data is evaluated as null even though I ca...
- Subscribe to RSS Feed
- Mark Topic as New
- Mark Topic as Read
- Float this Topic for Current User
- Bookmark
- Subscribe
- Mute
- Printer Friendly Page
- Mark as New
- Bookmark
- Subscribe
- Mute
- Subscribe to RSS Feed
- Permalink
- Report Inappropriate Content
Numeric data is evaluated as null even though I can see values when looking at the table.
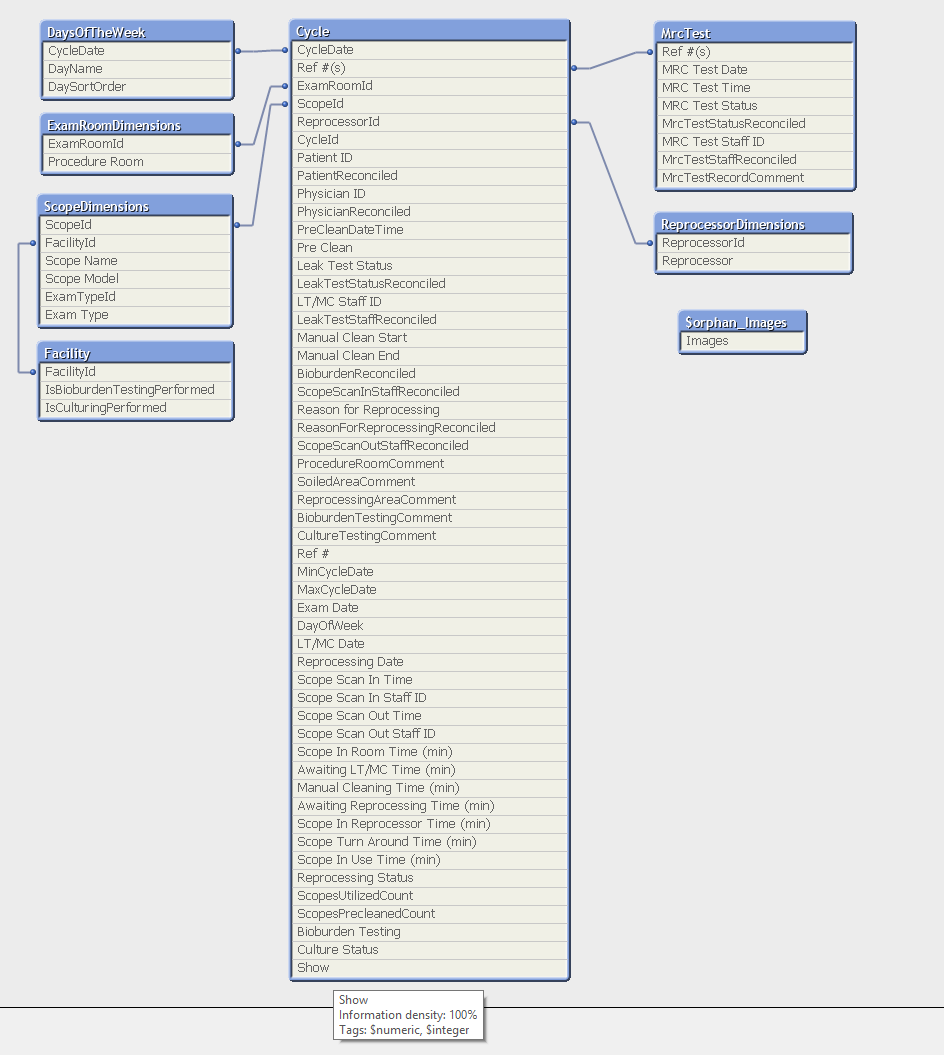
I am building a data model which has a field that is used as the expression in a straight table chart to determine if the record should be displayed on the table.
I am using "RowNo() as Show", to get the value for the filed.
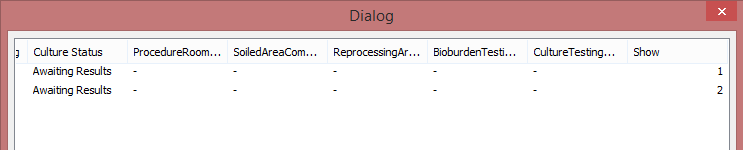
When I look at the table, my data model has values in this field.
Mouse over shows that the Show field has 100% Information density. So no nulls. The following screen shot shows the data in the table. The Show column has values 1 and 2 for the 1st and 2nd rows.
My expression uses a simple =Show definition which should show a row if it has a value. And hide if it is null.
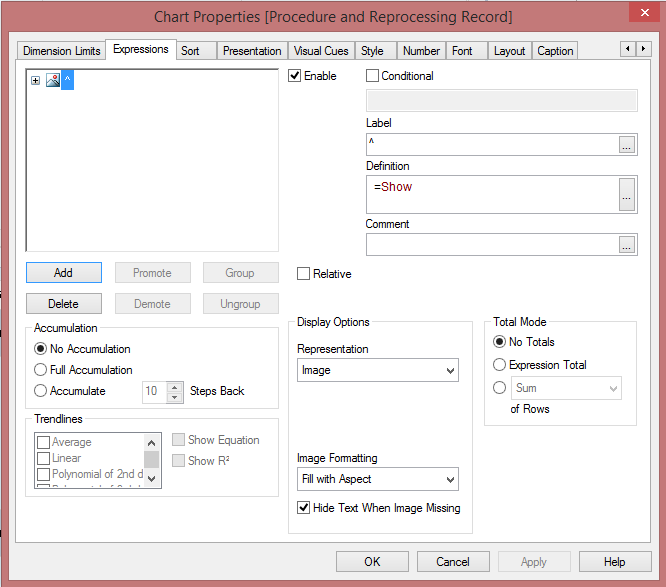
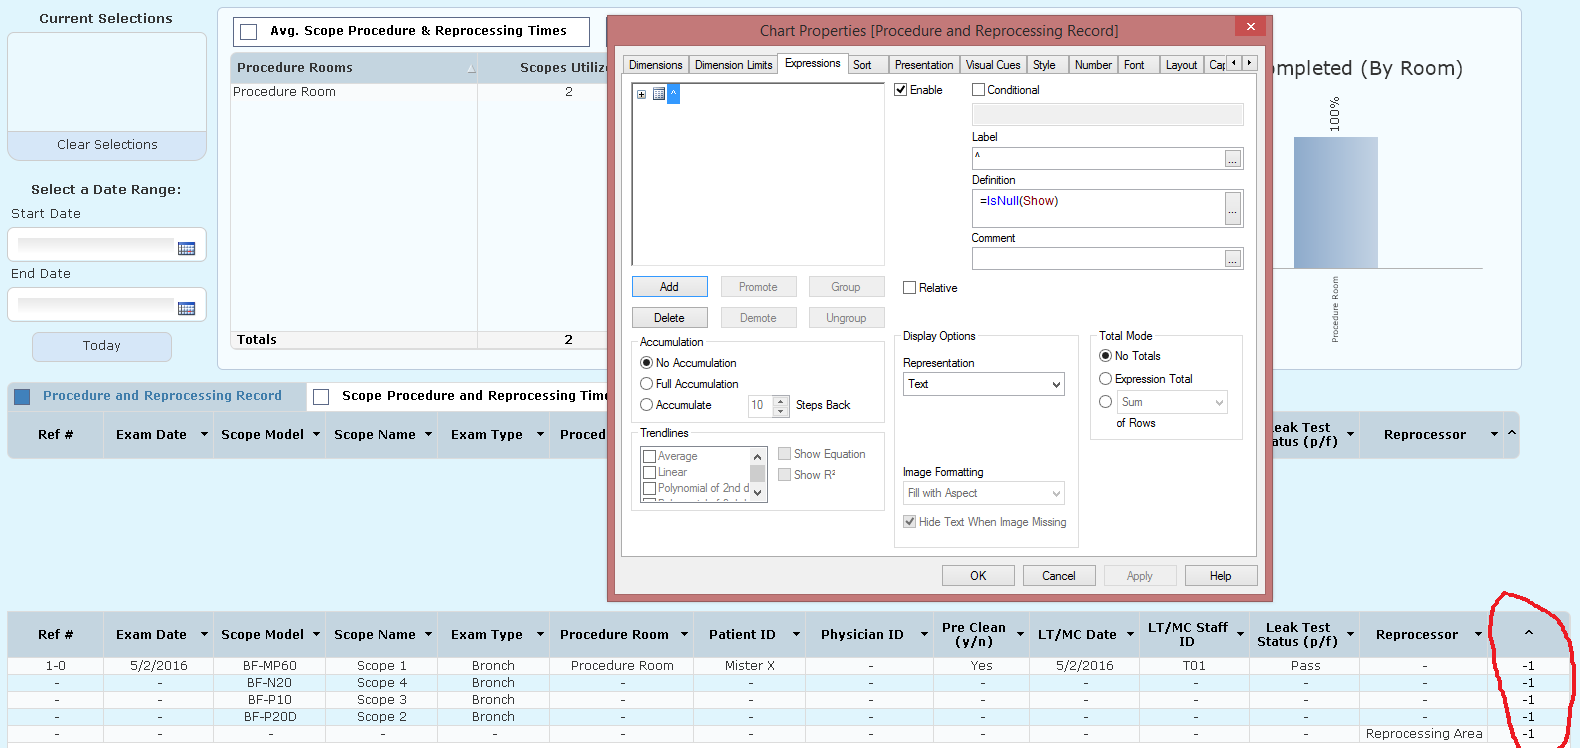
The straight table chart under the settings box has Show defined as in the above screenshot, while the bottom straight table chart has Show defined as in the settings popup in the screenshot below. Notice that the Show column displays -1 which means that the value is null. I am quite confused how I seem to have data but my expressions are treating the data as null. Any ideas?
Accepted Solutions
- Mark as New
- Bookmark
- Subscribe
- Mute
- Subscribe to RSS Feed
- Permalink
- Report Inappropriate Content
May be there are more than one value to show and that is why Show alone is defaulting to null. Can you try this -> Concat(DISTINCT Show, ' | ') to see what all values does show take for a particular row
- Mark as New
- Bookmark
- Subscribe
- Mute
- Subscribe to RSS Feed
- Permalink
- Report Inappropriate Content
If you're using =Show as then you're using an implicit aggregation. Qlikview will apply the Only() function. So =Show is actually =Only(Show). The only function only returns a value (hence its name) when there is only one possible value. If for the combination of dimension values on the row of the chart there are two or more values, e.g. 1 and 2, then the result of only(Show) will be Null. Try for example Sum(Show) instead. You'll likely see results then instead of nulls.
talk is cheap, supply exceeds demand
- Mark as New
- Bookmark
- Subscribe
- Mute
- Subscribe to RSS Feed
- Permalink
- Report Inappropriate Content
Both answers were correct. It was an issue with the dataset.