Unlock a world of possibilities! Login now and discover the exclusive benefits awaiting you.
- Qlik Community
- :
- All Forums
- :
- QlikView App Dev
- :
- Line Chart with Zero
- Subscribe to RSS Feed
- Mark Topic as New
- Mark Topic as Read
- Float this Topic for Current User
- Bookmark
- Subscribe
- Mute
- Printer Friendly Page
- Mark as New
- Bookmark
- Subscribe
- Mute
- Subscribe to RSS Feed
- Permalink
- Report Inappropriate Content
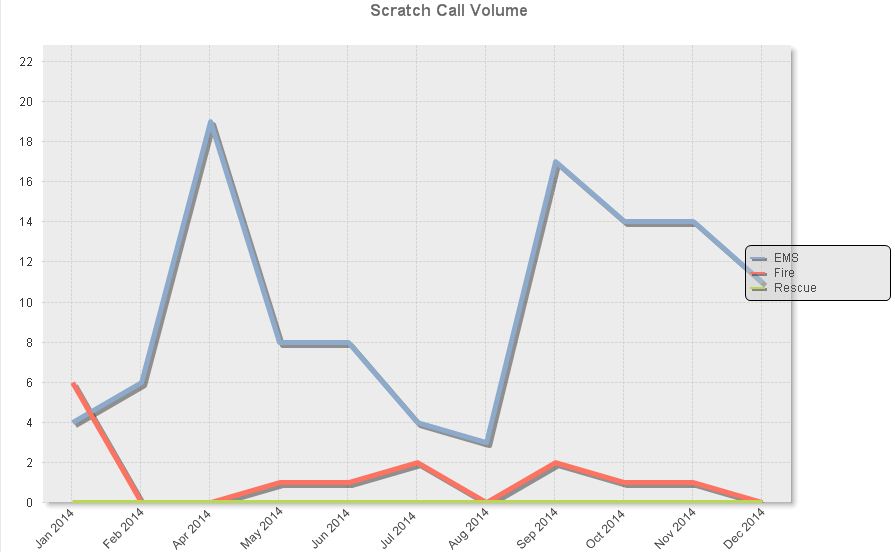
Line Chart with Zero
So I want to create a line chart but it has to handle zero values in months where we had no scratches in our fire department. Essentially when a user selects a year my chart it should display a line chart thru the twelve months and draws the line segments. There are some months we have no scratches so the chart skips that month and draws the wrong segement. I need it draw the line down to zero.
Can any one help. Attached is my data I am working with.
Thanks
~Norman
Accepted Solutions
- Mark as New
- Bookmark
- Subscribe
- Mute
- Subscribe to RSS Feed
- Permalink
- Report Inappropriate Content
- Mark as New
- Bookmark
- Subscribe
- Mute
- Subscribe to RSS Feed
- Permalink
- Report Inappropriate Content
Do you have a qvw which have the data loaded into it?? Seeing that will be more helpful, then just looking at the data.
- Mark as New
- Bookmark
- Subscribe
- Mute
- Subscribe to RSS Feed
- Permalink
- Report Inappropriate Content
Here is my QVW filw.
Norm
- Mark as New
- Bookmark
- Subscribe
- Mute
- Subscribe to RSS Feed
- Permalink
- Report Inappropriate Content
Hi,
one solution could be:
hope this helps
regards
Marco
- Mark as New
- Bookmark
- Subscribe
- Mute
- Subscribe to RSS Feed
- Permalink
- Report Inappropriate Content
You will need to create zero (or near zero) values for each month if no data available for that month.
if you put in a value of .001 but tell chart to round to whole numbers ot will show a data point of zero and get you the desired results.
You can add the "zero" month values in the script as a second load where no vales are found for a given month.