Unlock a world of possibilities! Login now and discover the exclusive benefits awaiting you.
- Qlik Community
- :
- All Forums
- :
- QlikView App Dev
- :
- I am having a problem in creating pie chart as per...
- Subscribe to RSS Feed
- Mark Topic as New
- Mark Topic as Read
- Float this Topic for Current User
- Bookmark
- Subscribe
- Mute
- Printer Friendly Page
- Mark as New
- Bookmark
- Subscribe
- Mute
- Subscribe to RSS Feed
- Permalink
- Report Inappropriate Content
I am having a problem in creating pie chart as per my requirements
I have simple data as shown below:
| Names | Marks |
| A | 2 |
| B | 3 |
| C | 4 |
| D | 5 |
| E | 6 |
| F | 7 |
| G | 8 |
| H | 9 |
| I | 10 |
| J | 11 |
| K | 12 |
| L | 16 |
| M | 17 |
| N | 20 |
| O | 21 |
| P | 34 |
| Q | 50 |
Now I want to create a pie chart with 3 pies on it as: 1) Marks Less than 10
2) Marks Between 10-20
3) Marks Greater than 20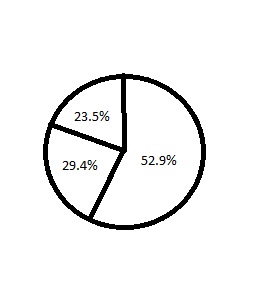
And show their percentages as shown. I don't know if I have to create groups or what. Please explain this in detailed manner as I am new to QlikView
- Tags:
- new_to_qlikview
- « Previous Replies
-
- 1
- 2
- Next Replies »
Accepted Solutions
- Mark as New
- Bookmark
- Subscribe
- Mute
- Subscribe to RSS Feed
- Permalink
- Report Inappropriate Content
Looks like there is a space missing between INLINE and the [. Try this:
LOAD
*,
if(Mark < 10, '< 10', if(Mark < 20, '10 to 20', '> 20')) as Bucket;
LOAD * INLINE [
Name, Mark
A, 2
B, 3
C, 4
D, 5
E, 6
F, 7
G, 8
H, 9
I, 10
J, 11
K, 12
L, 16
M, 17
N, 20
O, 21
P, 34
Q, 50
];
- Mark as New
- Bookmark
- Subscribe
- Mute
- Subscribe to RSS Feed
- Permalink
- Report Inappropriate Content
LOAD * Inline [
Names ,Marks
A ,2
B, 3
C ,4
D, 5
E, 6
F, 7
G, ,8
H, 9
I, 10
J, 11
K, 12
L, 16
M ,17
N ,20
O, 21
P,34
Q, 50
];
NoConcatenate
LOAD Names,if(Marks<10,Dual('0-10',1),if(Marks>=10 and Marks<=20, Dual('10-20',2),
if(Marks>20,Dual('20',3)))) as Age Resident TableA;
use Age as Dimension and marks as Expression u will get 3 Slices like u want as i understood correctly
- Mark as New
- Bookmark
- Subscribe
- Mute
- Subscribe to RSS Feed
- Permalink
- Report Inappropriate Content
Please find the attachment
- Mark as New
- Bookmark
- Subscribe
- Mute
- Subscribe to RSS Feed
- Permalink
- Report Inappropriate Content
Will this work for you?
- Mark as New
- Bookmark
- Subscribe
- Mute
- Subscribe to RSS Feed
- Permalink
- Report Inappropriate Content
Dear,
find the attached file.
- Mark as New
- Bookmark
- Subscribe
- Mute
- Subscribe to RSS Feed
- Permalink
- Report Inappropriate Content
or else if u want to use in front end mean use class function but class function usually give equal interval
class(marks,10) if u dont want <= ,<, X, symbol mean ,use replace function and replace the symbol
when u use class class function some time u wont get the sort order position correctly so go to the sort tab and sort text A-Z
- Mark as New
- Bookmark
- Subscribe
- Mute
- Subscribe to RSS Feed
- Permalink
- Report Inappropriate Content
Thanks for the reply, but after running the script when I select pie chart after right clicking, there is no Age option as dimension. All I am getting two fields Names and Marks.
- Mark as New
- Bookmark
- Subscribe
- Mute
- Subscribe to RSS Feed
- Permalink
- Report Inappropriate Content
Thanks for your reply. I think i am using QlikView personal edition. Hence I am unable to open your attached file. Can you please explain the process in steps. That will be very helpful.
- Mark as New
- Bookmark
- Subscribe
- Mute
- Subscribe to RSS Feed
- Permalink
- Report Inappropriate Content
Thanks for your reply. I think i am using QlikView personal edition. Hence I am unable to open your attached file. Can you please explain the process in steps. That will be very helpful.
- Mark as New
- Bookmark
- Subscribe
- Mute
- Subscribe to RSS Feed
- Permalink
- Report Inappropriate Content
Thanks for your reply. I think i am using QlikView personal edition. Hence I am unable to open your attached file. Can you please explain the process in steps. That will be very helpful.
- « Previous Replies
-
- 1
- 2
- Next Replies »