Unlock a world of possibilities! Login now and discover the exclusive benefits awaiting you.
- Qlik Community
- :
- All Forums
- :
- QlikView App Dev
- :
- How could I do a "stack chart" in Qlikview ?
- Subscribe to RSS Feed
- Mark Topic as New
- Mark Topic as Read
- Float this Topic for Current User
- Bookmark
- Subscribe
- Mute
- Printer Friendly Page
- Mark as New
- Bookmark
- Subscribe
- Mute
- Subscribe to RSS Feed
- Permalink
- Report Inappropriate Content
How could I do a "stack chart" in Qlikview ?
Hey guys, i'm struggling with this stuff. I'm pretty sure is quite easy, but I can't find out how could I convert this chart :
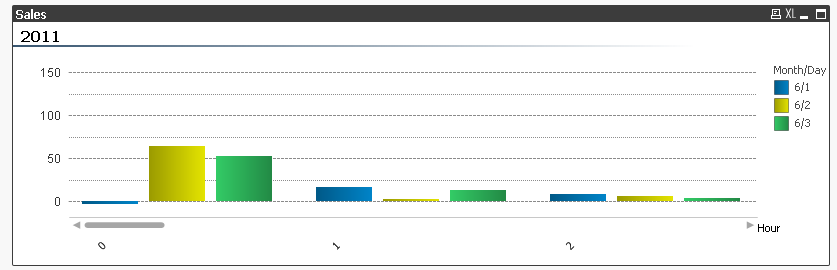
It's a sales chart witth two dimensions : hours, and month/day. I would like to merge the hour dimension with month/day in one pile, to get only a bar per hour.
How could I do that?
Many thanks in advance!!
Accepted Solutions
- Mark as New
- Bookmark
- Subscribe
- Mute
- Subscribe to RSS Feed
- Permalink
- Report Inappropriate Content
Hi Marcel, you can try creating a bar chart with the following configuration:
Dimensions: Hour, MonthDay
Expression: sum(Sales)
Then go to properties-> Style-> Subtype-> Stacked
See attached example.
Regards
- Mark as New
- Bookmark
- Subscribe
- Mute
- Subscribe to RSS Feed
- Permalink
- Report Inappropriate Content
The main idea is that you cannot do "Stacked chart" if you have just one dimension.
- Mark as New
- Bookmark
- Subscribe
- Mute
- Subscribe to RSS Feed
- Permalink
- Report Inappropriate Content
Thanks Ivan, it was quite simple. As I thought.