Unlock a world of possibilities! Login now and discover the exclusive benefits awaiting you.
- Qlik Community
- :
- All Forums
- :
- QlikView App Dev
- :
- Help With Chart
- Subscribe to RSS Feed
- Mark Topic as New
- Mark Topic as Read
- Float this Topic for Current User
- Bookmark
- Subscribe
- Mute
- Printer Friendly Page
- Mark as New
- Bookmark
- Subscribe
- Mute
- Subscribe to RSS Feed
- Permalink
- Report Inappropriate Content
Help With Chart
Hi Guy's
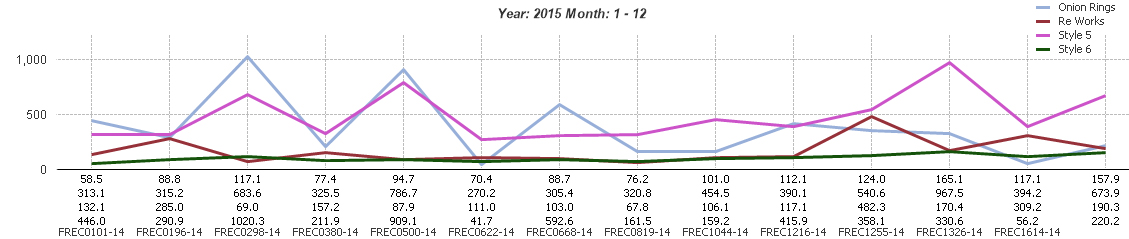
I am creating a linear graph with some figures but need help with it. If you see the image, there are values on the axes of the graph. Is there a way i can put the wording thats in the legend in the top right next to the values on the axes to make it easier to read ?
Kind regards
- Tags:
- new_to_qlikview
Accepted Solutions
- Mark as New
- Bookmark
- Subscribe
- Mute
- Subscribe to RSS Feed
- Permalink
- Report Inappropriate Content
As per my knowledge dynamically not possible, but you can added the text in chart option but it will be static
- Mark as New
- Bookmark
- Subscribe
- Mute
- Subscribe to RSS Feed
- Permalink
- Report Inappropriate Content
As per my understanding you need to change the position for the legend? if so select the chart and press
CTRL+ALT , now you will see the legend portion and you can move to the position you want .
- Mark as New
- Bookmark
- Subscribe
- Mute
- Subscribe to RSS Feed
- Permalink
- Report Inappropriate Content
You can drag the legend by pressing Ctrl+Shift
- Mark as New
- Bookmark
- Subscribe
- Mute
- Subscribe to RSS Feed
- Permalink
- Report Inappropriate Content
Ashley,
Click the "Reset User Sizing" and "Reset User Docking" buttons on Chart Properties/General, Then press Ctrl and Shift key together untill you see red lines inside the chart. Drag it and position the legend wherever you want.
- Mark as New
- Bookmark
- Subscribe
- Mute
- Subscribe to RSS Feed
- Permalink
- Report Inappropriate Content
Hi Guy's
Thanks so much for the quick response but i do not want to move the legend at all. I just want to make it easier to read the figure by having the wording next to each value provided. Is this possible ? Regards
- Mark as New
- Bookmark
- Subscribe
- Mute
- Subscribe to RSS Feed
- Permalink
- Report Inappropriate Content
As per my knowledge dynamically not possible, but you can added the text in chart option but it will be static