Unlock a world of possibilities! Login now and discover the exclusive benefits awaiting you.
- Qlik Community
- :
- All Forums
- :
- QlikView App Dev
- :
- Re: Dimension as label in pie chart
- Subscribe to RSS Feed
- Mark Topic as New
- Mark Topic as Read
- Float this Topic for Current User
- Bookmark
- Subscribe
- Mute
- Printer Friendly Page
- Mark as New
- Bookmark
- Subscribe
- Mute
- Subscribe to RSS Feed
- Permalink
- Report Inappropriate Content
Dimension as label in pie chart
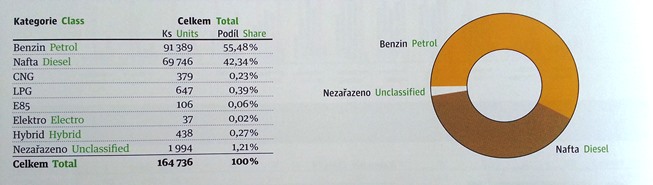
Hello, I want to use pie chart along with table only as graphic expression of data in table. So I dont need to have expressions shown "on data points" but I want to have Dimension there instead.
Like here:
Thank you!! 
- Tags:
- new_to_qlikview
- « Previous Replies
-
- 1
- 2
- Next Replies »
- Mark as New
- Bookmark
- Subscribe
- Mute
- Subscribe to RSS Feed
- Permalink
- Report Inappropriate Content
go to presentation tab and select Show Legend and Show numbers in legend
- Mark as New
- Bookmark
- Subscribe
- Mute
- Subscribe to RSS Feed
- Permalink
- Report Inappropriate Content
Hi Viktor,
well, not displaying the figures in the chart should be doable by unchecking the checkbox on the "expressions" tab in the properties dialog.
As to displaying the dimension - you'd have to either use a caption to the chart or make a textbox with a transparent background and place it in the middle of the ring.
Best regards,
DataNibbler
- Mark as New
- Bookmark
- Subscribe
- Mute
- Subscribe to RSS Feed
- Permalink
- Report Inappropriate Content
Noooooo  ...Is that really the only way how to display dimension label in pie chart? - by using the textbox?
Uff ...I am bit disappointed now 
- Mark as New
- Bookmark
- Subscribe
- Mute
- Subscribe to RSS Feed
- Permalink
- Report Inappropriate Content
With no response... and I tried it with checked and also unchecked "Values on Data Points" in Expressions tab
- Mark as New
- Bookmark
- Subscribe
- Mute
- Subscribe to RSS Feed
- Permalink
- Report Inappropriate Content
Hi,
I just looked in an app where I have a piechart - you can also use a "free_text" ("presentation" tab) which is part of the chart. You can of course use a field - your dimension - to display there and you can position it anywhere in the charting_area => Put the zoom_factor to 200 or so to be able to position it precisely, it is a bit fickle to do.
- Mark as New
- Bookmark
- Subscribe
- Mute
- Subscribe to RSS Feed
- Permalink
- Report Inappropriate Content
Try like this Presentation--> Text in chart
- Mark as New
- Bookmark
- Subscribe
- Mute
- Subscribe to RSS Feed
- Permalink
- Report Inappropriate Content
Yes, I just discovered the "Text in Chart" field in presentation tab. It creates text fields as part of the chart which are able to move using ctrl+shift.
As I am a beginner and have very small understanding for codes ...can you tell me if there is a possibility to tell the Qlickview to put the dimension label there automatically?
If I have to make only few Pcharts, the "text in chart" feature is OK, but I have to do it for mabye 50 car brands every month... so I am looking for more autonomous solution.
- Mark as New
- Bookmark
- Subscribe
- Mute
- Subscribe to RSS Feed
- Permalink
- Report Inappropriate Content
hi ,
One other way is there ,
try to concat both fields like
lLOAD
categories,
class,
categories&'-'&class as CAT_CLASS,
.
.
From........Table
use that field in your pie chart
- Mark as New
- Bookmark
- Subscribe
- Mute
- Subscribe to RSS Feed
- Permalink
- Report Inappropriate Content
See the attached file
- « Previous Replies
-
- 1
- 2
- Next Replies »