Unlock a world of possibilities! Login now and discover the exclusive benefits awaiting you.
- Qlik Community
- :
- All Forums
- :
- QlikView App Dev
- :
- Different color for a bar based on Reference Value
- Subscribe to RSS Feed
- Mark Topic as New
- Mark Topic as Read
- Float this Topic for Current User
- Bookmark
- Subscribe
- Mute
- Printer Friendly Page
- Mark as New
- Bookmark
- Subscribe
- Mute
- Subscribe to RSS Feed
- Permalink
- Report Inappropriate Content
Different color for a bar based on Reference Value
HI everyone,
I have a requirement that in Bar chart i am using Reference line, so i want one color above the reference line and other color below the reference. I have attached the sample scrren shot, in which 25 is the value indicating the Reference line, i want different color above that 25 value reference line. Iam using Qv 9 sr7, how can i achieve dis.
Thanx in Advance
Nikitha Jain
Accepted Solutions
- Mark as New
- Bookmark
- Subscribe
- Mute
- Subscribe to RSS Feed
- Permalink
- Report Inappropriate Content
- Mark as New
- Bookmark
- Subscribe
- Mute
- Subscribe to RSS Feed
- Permalink
- Report Inappropriate Content
See attached qvw.
talk is cheap, supply exceeds demand
- Mark as New
- Bookmark
- Subscribe
- Mute
- Subscribe to RSS Feed
- Permalink
- Report Inappropriate Content
Hi Nikitha,
Please find the attached qvw.
In my example,I have used the reference value as 7.
Regards,
Snehal Nabar
- Mark as New
- Bookmark
- Subscribe
- Mute
- Subscribe to RSS Feed
- Permalink
- Report Inappropriate Content
Thank u very much. It worked .. 
- Mark as New
- Bookmark
- Subscribe
- Mute
- Subscribe to RSS Feed
- Permalink
- Report Inappropriate Content
Gysbert,
I am not able to grap the requirement of your qvw.
please explain.
- Mark as New
- Bookmark
- Subscribe
- Mute
- Subscribe to RSS Feed
- Permalink
- Report Inappropriate Content
hi Gysbert,
The color is working fine but the value on the bar is not available though 'value on data point' is checked. so i want the value to be displayed on each bar. can u pls suggest abt this
i Have attached the screenshot.
Thanks in advance,
Nikitha
- Mark as New
- Bookmark
- Subscribe
- Mute
- Subscribe to RSS Feed
- Permalink
- Report Inappropriate Content
On the Expression tab enable Values on Data Points only for the second expression.
talk is cheap, supply exceeds demand
- Mark as New
- Bookmark
- Subscribe
- Mute
- Subscribe to RSS Feed
- Permalink
- Report Inappropriate Content
Thank u very much Gysbert, nw i am getting exactly what i want.
- Mark as New
- Bookmark
- Subscribe
- Mute
- Subscribe to RSS Feed
- Permalink
- Report Inappropriate Content
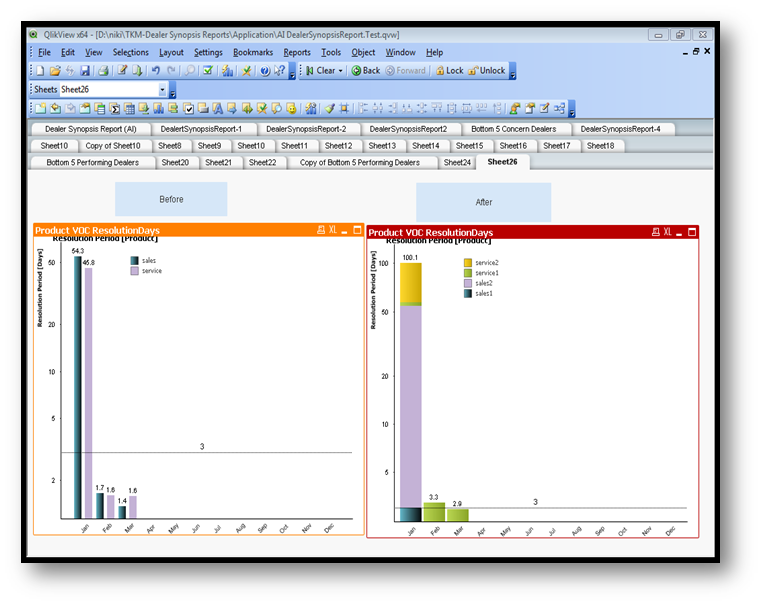
Hi Gysbert,
I hve attached one screenshot, In that every month has 2 bars Representing sales nd service respectively. if i want different color above the reference line seperately hw can do this. If i try to put the expressions wat u hve attached and stacked i am getting al in one bar only. i want sales1 nd sales2 as one bar service1 nd service2 as other bar.
Thanks in Advance,
Nikitha