Unlock a world of possibilities! Login now and discover the exclusive benefits awaiting you.
- Qlik Community
- :
- All Forums
- :
- QlikView App Dev
- :
- Chart highlighting
- Subscribe to RSS Feed
- Mark Topic as New
- Mark Topic as Read
- Float this Topic for Current User
- Bookmark
- Subscribe
- Mute
- Printer Friendly Page
- Mark as New
- Bookmark
- Subscribe
- Mute
- Subscribe to RSS Feed
- Permalink
- Report Inappropriate Content
Chart highlighting
Hi
I'm trying to build reports for different counties
Attached is the sample app and data for reference.
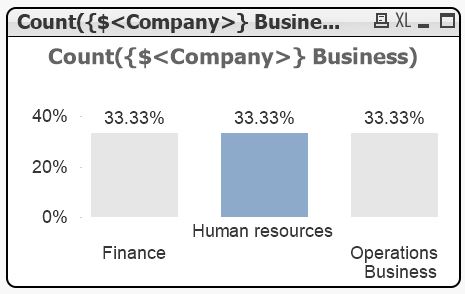
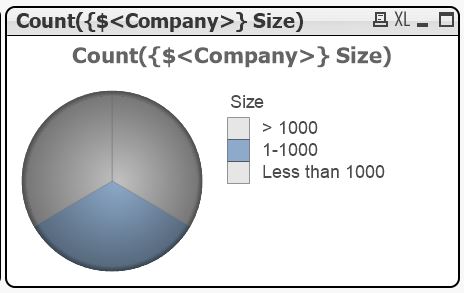
I'm trying to highlight the bar or portion of the Pie with completly different color and rest of the bars/pie with 1 color
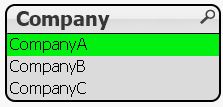
For example, Company A belongs to USA, Healthcare, Human resources and fall under 1-1000 size
When I'm generating the report for Company A, I should highlight USA, Healthcare, Human resources and fall under 1-1000 size with 1 color and the rest of the bars with another color
I CANNOT filter for each company as it result to 100 %.
Also i cannot hard code the color based on Company as it has around 500 companies
I need to highlight the bars/pie to which the company correspond to
When i'm sending the report for Company A, it should highlight USA, Healthcare, Human resources and fall under 1-1000 size with 1 color and the rest of the bars with another color
When i'm sending the report for Company B, it should highlight UK, Finance, Energy and fall under Less than 1000 size with 1 color and the rest of the bars with another color
and
So On.....
Is there any better way to achieve this?
Please help.
Accepted Solutions
- Mark as New
- Bookmark
- Subscribe
- Mute
- Subscribe to RSS Feed
- Permalink
- Report Inappropriate Content
Hi,
one solution could be:
see also:
Focus not Filter | Qlikview Cookbook
Search Recipes | Qlikview Cookbook
Line Chart tricks: Displaying what's important
Different Ways to Interact & Display Information With Bar Charts & Tables | QVDesign
Highlighting Redux – Alternate States to the Rescue! » The Qlik Board!
Alternate States Brushing Demo - YouTube
Qlikview Color Brushing Bars by RFB 160 - YouTube
hope this helps
regards
Marco
- Mark as New
- Bookmark
- Subscribe
- Mute
- Subscribe to RSS Feed
- Permalink
- Report Inappropriate Content
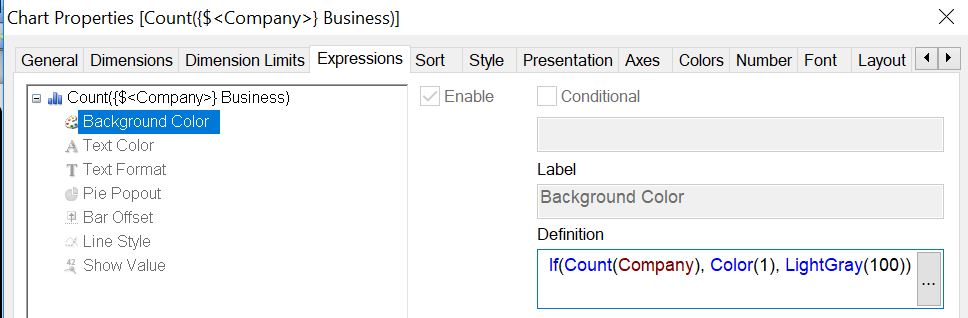
Have you tried using expression for the color
IF(size='1-1000', '#778899','#008b8b')
If you want to give each size band a different color, you can create a color dimension during the load period
Size_Color:
Load *,
pick(match("Size",'1-1000','Less than 1000','> 1000'),RGB(250,120,0),RGB(50,130,164),RGB(140,120,8))as "Size Color"
Resident data;
Then set the color expression as [Size Color]
- Mark as New
- Bookmark
- Subscribe
- Mute
- Subscribe to RSS Feed
- Permalink
- Report Inappropriate Content
I do not want to hard code the values as it contains different entries and not constant
Here is the thing,
If i need report for CompanyA, It should highlight the associated values for that Country as 1 color and Unassociated values in another color. AND we should not make a selection in Company as it results all charts to 100 %
Hope this clarifies...
- Mark as New
- Bookmark
- Subscribe
- Mute
- Subscribe to RSS Feed
- Permalink
- Report Inappropriate Content
Not Clear of what you want to achieve. How would Qlik know that you need a report for CompanyA without making a selection? There should be something to trigger the color change.
- Mark as New
- Bookmark
- Subscribe
- Mute
- Subscribe to RSS Feed
- Permalink
- Report Inappropriate Content
Yes. Even I'm thinking the same.
But there are some reports in Power point where it has been achieved by writing macros.
Not sure how to handle this in QlikView
- Mark as New
- Bookmark
- Subscribe
- Mute
- Subscribe to RSS Feed
- Permalink
- Report Inappropriate Content
Hi,
one solution could be:
see also:
Focus not Filter | Qlikview Cookbook
Search Recipes | Qlikview Cookbook
Line Chart tricks: Displaying what's important
Different Ways to Interact & Display Information With Bar Charts & Tables | QVDesign
Highlighting Redux – Alternate States to the Rescue! » The Qlik Board!
Alternate States Brushing Demo - YouTube
Qlikview Color Brushing Bars by RFB 160 - YouTube
hope this helps
regards
Marco