Unlock a world of possibilities! Login now and discover the exclusive benefits awaiting you.
- Qlik Community
- :
- All Forums
- :
- QlikView App Dev
- :
- Aged Debt Analysis In Qlik
- Subscribe to RSS Feed
- Mark Topic as New
- Mark Topic as Read
- Float this Topic for Current User
- Bookmark
- Subscribe
- Mute
- Printer Friendly Page
- Mark as New
- Bookmark
- Subscribe
- Mute
- Subscribe to RSS Feed
- Permalink
- Report Inappropriate Content
Aged Debt Analysis In Qlik
Hi All
I'm really struggling on this one hoping someone can help. I am attempting to create an aged debt report in Qlikview based on a ledger table which plots entries into a table against a customer. When a customer is invoiced (say £120) an "Initial Entry" type goes in at a given date (say 15th November). When the customer pays, we then enter an "Allocation" into that table (of £-120) and lets say they pay January 5th. This would result in a current balance of £0 - no problem with that.
It's easy enough just to produce a table showing the current balance for that customer (which would be 0) but what I want to do is a report which will show the balance over a number of months. So in this example the desired "Balance" (expression) I would want to be:
November: £120
December: £120
January: £0.
I hope that makes sense, I've attached an image showing a table and the desired result. 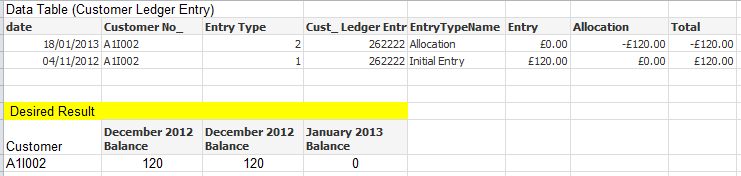
Thanks for any help!
Stu
Accepted Solutions
- Mark as New
- Bookmark
- Subscribe
- Mute
- Subscribe to RSS Feed
- Permalink
- Report Inappropriate Content
I have loaded your table into QV document and then created a pivot table. In the pivot table I have put Customer No as the dimension and 3 expressions.
1 - sum(if(DATE<= '30/11/2012',TOTAL,0)) --> Named it Balance by Nov
2 - sum(if(DATE<= '31/12/2012',TOTAL,0)) --> Named it Balance by Dec
3 - sum(if(DATE<= '31/01/2013',TOTAL,0)) --> Named it Balance by Jan
I hope this help!
MultiView
- Mark as New
- Bookmark
- Subscribe
- Mute
- Subscribe to RSS Feed
- Permalink
- Report Inappropriate Content
Thanks very much!