Unlock a world of possibilities! Login now and discover the exclusive benefits awaiting you.
- Qlik Community
- :
- All Forums
- :
- QlikView App Dev
- :
- Add a % column to a Pivot Table
- Subscribe to RSS Feed
- Mark Topic as New
- Mark Topic as Read
- Float this Topic for Current User
- Bookmark
- Subscribe
- Mute
- Printer Friendly Page
- Mark as New
- Bookmark
- Subscribe
- Mute
- Subscribe to RSS Feed
- Permalink
- Report Inappropriate Content
Add a % column to a Pivot Table
I need to add a percentage field to a pivot table, this percentage needs to be calculated by the expression over the same expression depending on the dimensions.
My current pivot table consists of 3 dimensions and 1 Expression
Dimensions:
City
Salesman
Year
Expression:
Sold units

i would like to add four columns at the end of the table showing the percentage between units sold at 2015 over each of the other years.
e.g.
Column1 = [Units Sold at 2015] / [Units sold at 2014]
Column2 = [Units Sold at 2015] / [Units sold at 2013]
Column3 = [Units Sold at 2015] / [Units sold at 2012]
Column4 = [Units Sold at 2015] / [Units sold at 2011]
Any help would be appreciated.
- Tags:
- new_to_qlikview
Accepted Solutions
- Mark as New
- Bookmark
- Subscribe
- Mute
- Subscribe to RSS Feed
- Permalink
- Report Inappropriate Content
Agreed jagan. Just I tried, can we try like the below
SET vMax=2015;
SET vMin=2011;
SET i=0;
SET S_No=1;


for i=vMin to vMax
Groups:
LOAD * INLINE
  [S_No,Year_New, Expr
     $(S_No),$(vMin), Sum({<Year={$(vMin)}>}Units)];
  S_No=$(S_No)+1;
  vMin=$(vMin)+1;
NEXT i;


SET vMax=2015;
SET vMin=2011;
SET i=0;
for i=vMin to vMax-1
Load * Inline
  [S_No,Year_New, Expr
  $(S_No),$(vMax) vs $(vMin), "num(Sum({<Year={$(vMax)}>} Units)/Sum({<Year={$(vMin)}>} Units),'#,##0.0%')"];
  vMin=vMin+1;
  S_No=S_No+1;
Next i;
- Mark as New
- Bookmark
- Subscribe
- Mute
- Subscribe to RSS Feed
- Permalink
- Report Inappropriate Content
For column1 = column(1) / column(2) -> column(1) represent units sold at 2015 and your column is named 2015.
For column2 = column(1) / column(3) -> column(3) is units sold at 2013.
For column3 = column(1) / column(4)
For column4 = column(1) / column(5).
Hope this helps
- Mark as New
- Bookmark
- Subscribe
- Mute
- Subscribe to RSS Feed
- Permalink
- Report Inappropriate Content
Hi facundopose ,
Can you attach the sample file?
- Mark as New
- Bookmark
- Subscribe
- Mute
- Subscribe to RSS Feed
- Permalink
- Report Inappropriate Content
Hi,
I think you can achieve this using Straight table. like the below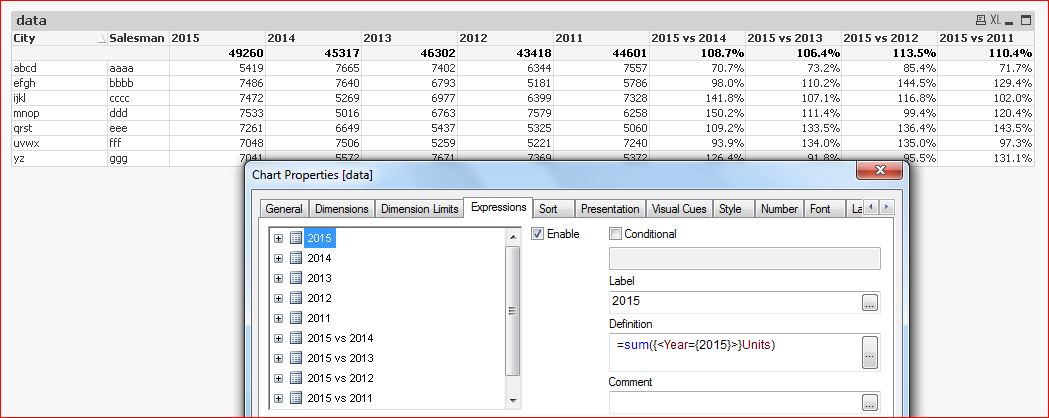
But still, if you want the data in pivot table, you need to create the one island table for the year and expressions, like the below
Groups:
LOAD * INLINE
[S_No, Year_New, Expr
1, 2015, Sum({<Year={2015}>}Units)
2, 2014, Sum({<Year={2014}>}Units)
3, 2013, Sum({<Year={2013}>}Units)
4, 2012, Sum({<Year={2012}>}Units)
5, 2011, Sum({<Year={2011}>}Units)
6, 2015 vs 2014, "num(Sum({<Year={2015}>} Units)/Sum({<Year={2014}>} Units),'#,##0.0%')"
7, 2015 vs 2013, "num(Sum({<Year={2015}>} Units)/Sum({<Year={2013}>} Units),'#,##0.0%')"
8, 2015 vs 2012, "num(Sum({<Year={2015}>} Units)/Sum({<Year={2013}>} Units),'#,##0.0%')"
9, 2015 vs 2011, "num(Sum({<Year={2015}>} Units)/Sum({<Year={2013}>} Units),'#,##0.0%')"];


New_Group:
LOAD Replace(concat(Expr,',',S_No), '|', '$') as Expressions
RESIDENT Groups;
LET vGroup = 'pick(S_No,' & peek('Expressions') & ')';
DROP TABLE New_Group;
Then, you can just use the 'Year_New' Field in your dimension, and =$(vGroup) in your expression.
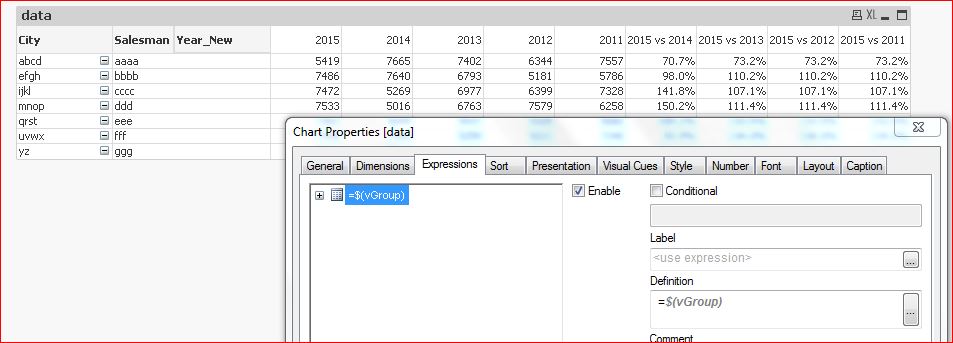
Find the attachment for your reference.
- Mark as New
- Bookmark
- Subscribe
- Mute
- Subscribe to RSS Feed
- Permalink
- Report Inappropriate Content
Hi,
This is some kind of hard coding, what if we are in year 2016? You have to change the code again.
Hi facundopose
How many years of data you want to Display? Last 3 Years or 5 Years? Then based on that the chart will update automatically. If possible attach some sample file. Then it would be easier to provide the solution.
Regards,
jagan.
- Mark as New
- Bookmark
- Subscribe
- Mute
- Subscribe to RSS Feed
- Permalink
- Report Inappropriate Content
Agreed jagan. Just I tried, can we try like the below
SET vMax=2015;
SET vMin=2011;
SET i=0;
SET S_No=1;


for i=vMin to vMax
Groups:
LOAD * INLINE
  [S_No,Year_New, Expr
     $(S_No),$(vMin), Sum({<Year={$(vMin)}>}Units)];
  S_No=$(S_No)+1;
  vMin=$(vMin)+1;
NEXT i;


SET vMax=2015;
SET vMin=2011;
SET i=0;
for i=vMin to vMax-1
Load * Inline
  [S_No,Year_New, Expr
  $(S_No),$(vMax) vs $(vMin), "num(Sum({<Year={$(vMax)}>} Units)/Sum({<Year={$(vMin)}>} Units),'#,##0.0%')"];
  vMin=vMin+1;
  S_No=S_No+1;
Next i;
- Mark as New
- Bookmark
- Subscribe
- Mute
- Subscribe to RSS Feed
- Permalink
- Report Inappropriate Content
Again 2011 and 2015 is hard coded, to overcome this try like below
- SET vMax=Year(Today());
- SET vMin=vMax - 4;
- Mark as New
- Bookmark
- Subscribe
- Mute
- Subscribe to RSS Feed
- Permalink
- Report Inappropriate Content