Unlock a world of possibilities! Login now and discover the exclusive benefits awaiting you.
- Qlik Community
- :
- All Forums
- :
- QlikView App Dev
- :
- About Coloring Dashboards in QlikView
- Subscribe to RSS Feed
- Mark Topic as New
- Mark Topic as Read
- Float this Topic for Current User
- Bookmark
- Subscribe
- Mute
- Printer Friendly Page
- Mark as New
- Bookmark
- Subscribe
- Mute
- Subscribe to RSS Feed
- Permalink
- Report Inappropriate Content
About Coloring Dashboards in QlikView
Hello Guys,
Once more i'm here asking for help.
Well, i have a dashboard in Excel, where it shows what we did on last months (JAN, FEB, MAR) and we have to do ->forecast<-
(APRIL,MAY AND JUNE) finishing the first semester of 2016.
The issue is that i have to divide these seasons by using colors in Qlikview. How can i do that? do i need to script something for it?
Follows the exact example on Excel: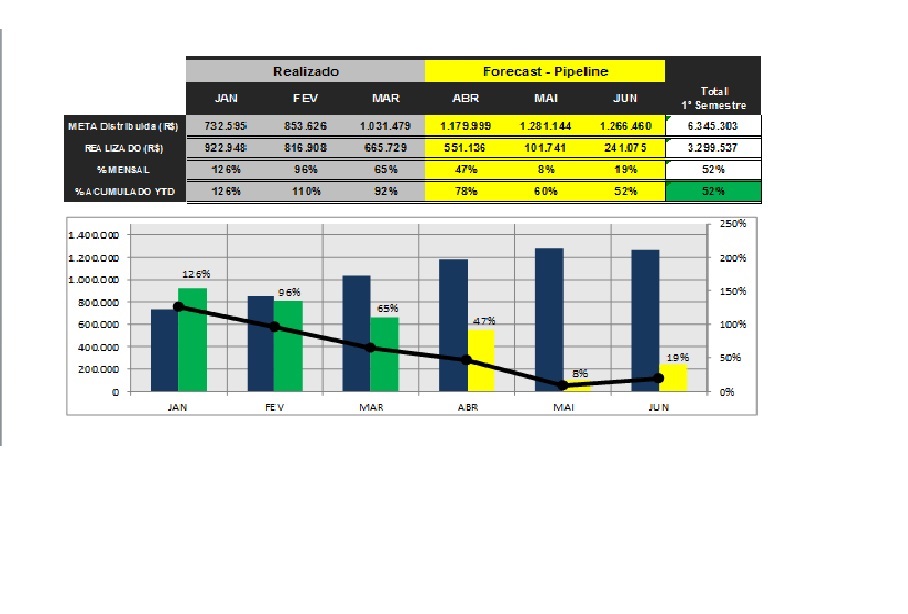
What we have done (grey) what i got to do (yellow).
How can i do it in Qlikview?
Thank you guys.
- Mark as New
- Bookmark
- Subscribe
- Mute
- Subscribe to RSS Feed
- Permalink
- Report Inappropriate Content
if(Filed='jan','feb','mar', yellow() ,if(Field='Apr','may','jun', red(),green())
- Mark as New
- Bookmark
- Subscribe
- Mute
- Subscribe to RSS Feed
- Permalink
- Report Inappropriate Content
Hey Chanty, thank you.
Does it adapts if we leave April month and start May, i mean does it became yellow for example when we leave our current month?
- Mark as New
- Bookmark
- Subscribe
- Mute
- Subscribe to RSS Feed
- Permalink
- Report Inappropriate Content
i tried this conditional but it just set the colors, i actually need to set the colors according the month we are, example if we are in may, its aotumatically set another color to april, if we are june set another standard color to may, etc..
- Mark as New
- Bookmark
- Subscribe
- Mute
- Subscribe to RSS Feed
- Permalink
- Report Inappropriate Content
Check out what I'm doing here with my chart.
Maybe this will help.