Unlock a world of possibilities! Login now and discover the exclusive benefits awaiting you.
- Qlik Community
- :
- All Forums
- :
- QlikView App Dev
- :
- 2 Box Plots in one chart
Options
- Subscribe to RSS Feed
- Mark Topic as New
- Mark Topic as Read
- Float this Topic for Current User
- Bookmark
- Subscribe
- Mute
- Printer Friendly Page
Turn on suggestions
Auto-suggest helps you quickly narrow down your search results by suggesting possible matches as you type.
Showing results for
Specialist II
2015-06-05
02:36 AM
- Mark as New
- Bookmark
- Subscribe
- Mute
- Subscribe to RSS Feed
- Permalink
- Report Inappropriate Content
2 Box Plots in one chart
Hi,
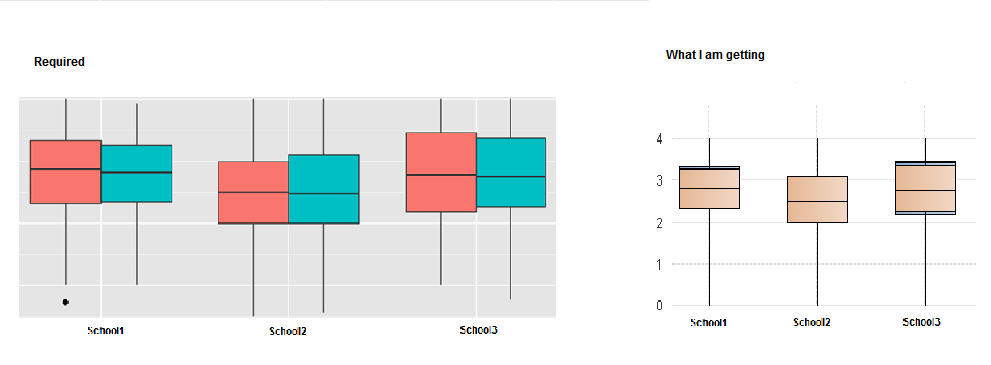
I want to compare the 2 measures in single Chart using Box Plots as shown in the bellow image. I am able to create the 2 box plots, but the problem is both box plots are overlapping.
Can anyone please help on this?
Thanks,
Pradeep
751 Views
4 Replies
Not applicable
2015-06-05
03:38 AM
- Mark as New
- Bookmark
- Subscribe
- Mute
- Subscribe to RSS Feed
- Permalink
- Report Inappropriate Content
can u share qvw. not clear on the requirement?
595 Views
Specialist II
2015-06-05
05:24 AM
Author
- Mark as New
- Bookmark
- Subscribe
- Mute
- Subscribe to RSS Feed
- Permalink
- Report Inappropriate Content
Please find the attached QVW application for the reference...
595 Views
Specialist II
2015-06-05
06:13 AM
- Mark as New
- Bookmark
- Subscribe
- Mute
- Subscribe to RSS Feed
- Permalink
- Report Inappropriate Content
Hi there,
find attachment.
Specialist II
2015-06-05
07:02 AM
Author
- Mark as New
- Bookmark
- Subscribe
- Mute
- Subscribe to RSS Feed
- Permalink
- Report Inappropriate Content
thanks Prem for your reply.
I want to showcase all 3 schools in same chart instead of side by side as in Trellis option.
In your approach, you are concatenating the data 2 times. If we have large volume of data, then it will be redundancy.
595 Views