Unlock a world of possibilities! Login now and discover the exclusive benefits awaiting you.
- Qlik Community
- :
- All Forums
- :
- QlikView Administration
- :
- Qlikview Server memory usage
- Subscribe to RSS Feed
- Mark Topic as New
- Mark Topic as Read
- Float this Topic for Current User
- Bookmark
- Subscribe
- Mute
- Printer Friendly Page
- Mark as New
- Bookmark
- Subscribe
- Mute
- Subscribe to RSS Feed
- Permalink
- Report Inappropriate Content
Qlikview Server memory usage
Hi all,
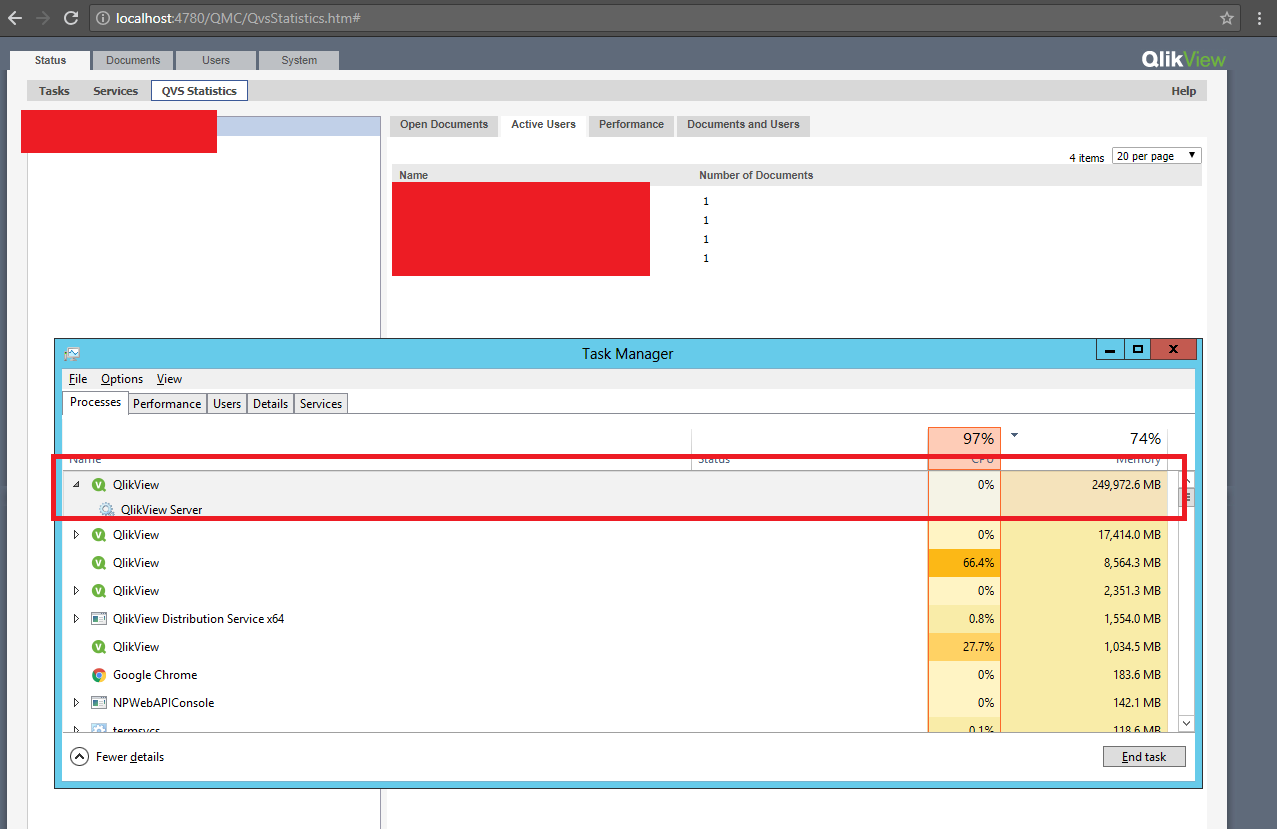
Just verified it here and I'm encountering a situation that even though few users are accessing the server and opening apps (even before the shift starts, so 2~3 users tops) the server memory usage is quite high.
Opened apps aren't that big that it would consume almost all the server memory, so I'm thinking it's not releasing app memory as it should, when the timeouts occur.
Memory usage:
Qlik version:
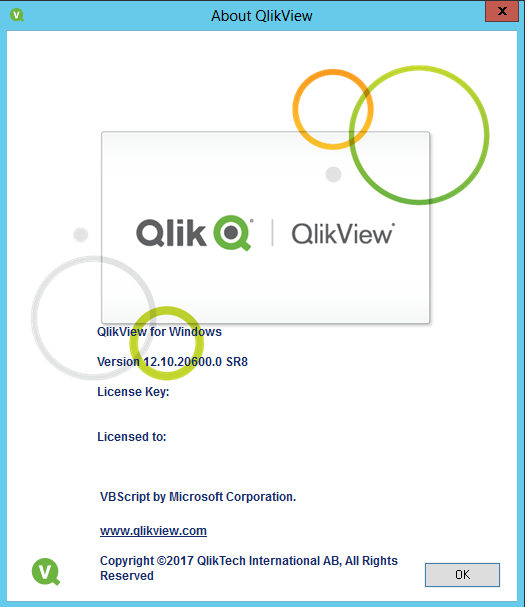
I've seen that some people reported memory leaks for version 12 sr4:
Memory Leake issue in QV12 SR4
Any help or suggestions would be appreciated.
Thanks in advance,
Felipe.
Accepted Solutions
- Mark as New
- Bookmark
- Subscribe
- Mute
- Subscribe to RSS Feed
- Permalink
- Report Inappropriate Content
"Reconnecting" happens usually because one of three reasons.
One, as one would expect, if the user session has indeed expired, which could happen because a hard timeout in QlikView but also in the load balancer, proxy, webserver, cookie, SSO, etc., or if the user is opening the same document in several tabs of the browser, or in different browsers.
Two, there is new data because the app has been reloaded or redistributed or even it was saved again while the user was using it.
Three, and this took me longer to troubleshoot (I was wrongly assuming the first two) because there is one object too complex. In most cases, using Ajax, you don't see any error message such as "Memory Exceeded" or "Object calculation timeout reached".
The app does not even reach the timeout defined in the QMC, you just get disconnected. I filed this as a bug in several versions of 11.20, but I'm experiencing the same with 12.10 and 12.20.
Maybe you have a very heavy object with many expressions, or complex calculated dimensions or variables within variables within variables that could be causing that?
Last, it could well be that the server is undersized for the current usage or complexity of the application, and even having 80% of the RAM utilized at all times, or whatever the working set low, it's not enough to cope with users requests. Again, in normal cases, you expect to have up to the working set low utilized and with good performance, this is how QlikView works, it's OK and not impacting negatively performance, rather the exact opposite: the more QlikView can cache into memory, the faster the response times will be.
- Mark as New
- Bookmark
- Subscribe
- Mute
- Subscribe to RSS Feed
- Permalink
- Report Inappropriate Content
The QlikView Server service doesn't de-allocate memory, even if the document timeout has passed.
So RAM consumption up to your working set low in QMC (70% of available RAM by default) is normal.
Beyond the working set low, you can check if your Documents are all preloaded into RAM.
- Mark as New
- Bookmark
- Subscribe
- Mute
- Subscribe to RSS Feed
- Permalink
- Report Inappropriate Content
Indeed, it looks like a lot of memory for so few users. However, how is the usage before? QlikView caches everything as long as resources are available, and if the server has been up and running for several weeks, seeing the server using the minimum working set is not unusual and rather expected.
A different story if it's impacting in the performance of the applications. I have been using that version until recently and we do see 90% of RAM constantly used, but we also experienced that with 11.20 and it is not impacting negatively opening times, response times or otherwise the use of the applications.
- Mark as New
- Bookmark
- Subscribe
- Mute
- Subscribe to RSS Feed
- Permalink
- Report Inappropriate Content
Problem is that even when it's on the lowest working set (set to 70%), users complain of perfomance issues for the server such as constantly reconnecting sessions (timeout) even though they're just a few minutes logged and the setting is set to 60 minutes for timeout, selections take forever to make (we have big apps, but sometimes the user just can't use it at all) and other minor issues.
Only solution I can do for this "slowness" is to restart services.
This gets the memory back to the minimum working set, but it seems to better user performance (same apps are opened and same amount of users).
Thanks for the help.
- Mark as New
- Bookmark
- Subscribe
- Mute
- Subscribe to RSS Feed
- Permalink
- Report Inappropriate Content
Yeah, I understand that preloading apps causes this high amount of memory (we do have it enabled here) but the issue alongside with the memory usage is the low performance for end-users.
Only solution that helps is restarting services for end-user actions (selections, timeouts and so on) as the memory and number of apps loaded return to the same minimum working set.
As I understand, when it enters the minimum working set, the server acts as it's "swaping" memory, and manages the memory as to not overload the server's memory usage when loading new apps.
Thanks for the response.
- Mark as New
- Bookmark
- Subscribe
- Mute
- Subscribe to RSS Feed
- Permalink
- Report Inappropriate Content
"Reconnecting" happens usually because one of three reasons.
One, as one would expect, if the user session has indeed expired, which could happen because a hard timeout in QlikView but also in the load balancer, proxy, webserver, cookie, SSO, etc., or if the user is opening the same document in several tabs of the browser, or in different browsers.
Two, there is new data because the app has been reloaded or redistributed or even it was saved again while the user was using it.
Three, and this took me longer to troubleshoot (I was wrongly assuming the first two) because there is one object too complex. In most cases, using Ajax, you don't see any error message such as "Memory Exceeded" or "Object calculation timeout reached".
The app does not even reach the timeout defined in the QMC, you just get disconnected. I filed this as a bug in several versions of 11.20, but I'm experiencing the same with 12.10 and 12.20.
Maybe you have a very heavy object with many expressions, or complex calculated dimensions or variables within variables within variables that could be causing that?
Last, it could well be that the server is undersized for the current usage or complexity of the application, and even having 80% of the RAM utilized at all times, or whatever the working set low, it's not enough to cope with users requests. Again, in normal cases, you expect to have up to the working set low utilized and with good performance, this is how QlikView works, it's OK and not impacting negatively performance, rather the exact opposite: the more QlikView can cache into memory, the faster the response times will be.
- Mark as New
- Bookmark
- Subscribe
- Mute
- Subscribe to RSS Feed
- Permalink
- Report Inappropriate Content
Hi Felip,
as the memory and number of apps loaded return to the same minimum working set.
As I understand, when it enters the minimum working set, the server acts as it's "swaping" memory, and manages the memory as to not overload the server's memory usage when loading new apps.
you say "returns" to working set low.
If you use more memory than working set low that means
no space for caching calculation results --> slow performance for users
If you even get past the working set high, then swapping starts and you are in real trouble
Think about upgrading you machinery, help with sizing is available as Qlik Consulting Package.
- Mark as New
- Bookmark
- Subscribe
- Mute
- Subscribe to RSS Feed
- Permalink
- Report Inappropriate Content
Reconnect without any message is something we have seen as well.
Huge App (>10GB) and a Pivot Table with selectable dimension and measure.
If the user picks a "bad" combination he gets the disconnect.
- Mark as New
- Bookmark
- Subscribe
- Mute
- Subscribe to RSS Feed
- Permalink
- Report Inappropriate Content
Thank you all for the responses, it clarified a lot for me here.
I'm marking Miguel's response as correct so others can see possible solutions.
Your remarks helpeds as well Frank.
Thanks again,
Felipe.