Unlock a world of possibilities! Login now and discover the exclusive benefits awaiting you.
- Qlik Community
- :
- Forums
- :
- Analytics
- :
- New to Qlik Analytics
- :
- Re: Count total distinct
- Subscribe to RSS Feed
- Mark Topic as New
- Mark Topic as Read
- Float this Topic for Current User
- Bookmark
- Subscribe
- Mute
- Printer Friendly Page
- Mark as New
- Bookmark
- Subscribe
- Mute
- Subscribe to RSS Feed
- Permalink
- Report Inappropriate Content
Count total distinct
Hi everyone
Im working on some data that looks like this:
DimA, DimB, Amount
Blue, 1, 100
Blue, 2, 100
Blue, 3, 100
Green, 1, 100
Green, 2, 100
Count(Distinct DimB) results in barchart as
Blue, 3
Green, 2
And the formulae COUNT(DISTINCT TOTAL DimB) results in 3
If I try and get the right relative value for each dimension, so that
Blue = 3 / 5 = 60%
Green = 2 / 5 = 40%
But the formulae COUNT(DISTINCT DimB) / COUNT(DISTINCT TOTAL DimB) results in =>
Blue 3/3 = 100%
Green 2/3 = 66%
I.e. the 3 / 5 should refer to the total sum of the rows.
In a bar chart how can I get the right relative value so that its based on the sum of the rows and not the count distinct?
Thank you
Accepted Solutions
- Mark as New
- Bookmark
- Subscribe
- Mute
- Subscribe to RSS Feed
- Permalink
- Report Inappropriate Content
- Mark as New
- Bookmark
- Subscribe
- Mute
- Subscribe to RSS Feed
- Permalink
- Report Inappropriate Content
Tried this as well but came up with the wrong values
=SUM(TOTAL Aggr( Count(Distinct DimB), DimA ))
- Mark as New
- Bookmark
- Subscribe
- Mute
- Subscribe to RSS Feed
- Permalink
- Report Inappropriate Content
COUNT(DISTINCT TOTAL DimB) will give you 3
COUNT( TOTAL DimB) will give you 5
Try
COUNT(DISTINCT DimB) / COUNT(TOTAL DimB)
- Mark as New
- Bookmark
- Subscribe
- Mute
- Subscribe to RSS Feed
- Permalink
- Report Inappropriate Content
That wouldn't give the distinct count in the denominator. I would think the Aggr() might be the easiest way.
- Mark as New
- Bookmark
- Subscribe
- Mute
- Subscribe to RSS Feed
- Permalink
- Report Inappropriate Content
Hi Ruan,
As i can see there are 3 distinct values of DimB on your data.
And this expression: COUNT(DISTINCT TOTAL DimB) will return 3.
If you want the result is 5, try this: COUNT(TOTAL DimB)
Best.
- Mark as New
- Bookmark
- Subscribe
- Mute
- Subscribe to RSS Feed
- Permalink
- Report Inappropriate Content
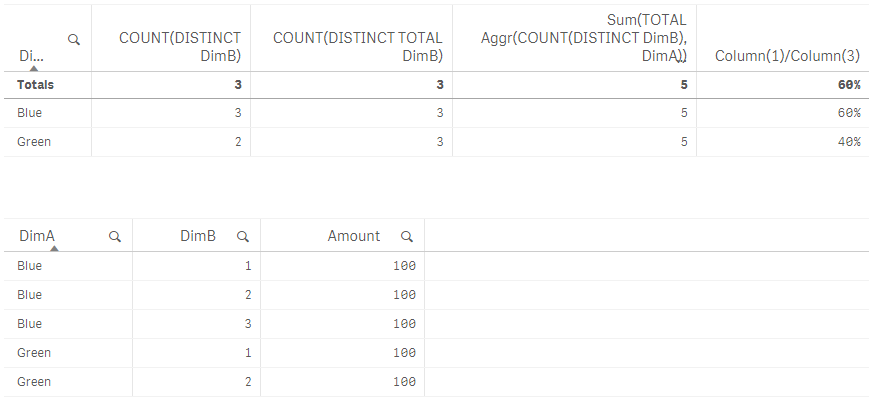
This should work.
Sum(TOTAL Aggr(COUNT(DISTINCT DimB), DimA))
- Mark as New
- Bookmark
- Subscribe
- Mute
- Subscribe to RSS Feed
- Permalink
- Report Inappropriate Content
Thanks, I agree it makes sense,
but as I mentioned earlier it returns the wrong value.
Edit: I played around with the data I provided and this solution
did return the correct values, so I'll mark it as correct.
Not quite sure why it didn't apply to my data though.
Thanks for the help.
Will play around with the AGGR function more.
- Mark as New
- Bookmark
- Subscribe
- Mute
- Subscribe to RSS Feed
- Permalink
- Report Inappropriate Content
Can you please provide the solution to this problem? I'm tryng to achieve the same result and have the same problem.
Thanks