Unlock a world of possibilities! Login now and discover the exclusive benefits awaiting you.
- Qlik Community
- :
- All Forums
- :
- QlikView App Dev
- :
- Adding reference line-Scatter Chart
- Subscribe to RSS Feed
- Mark Topic as New
- Mark Topic as Read
- Float this Topic for Current User
- Bookmark
- Subscribe
- Mute
- Printer Friendly Page
- Mark as New
- Bookmark
- Subscribe
- Mute
- Subscribe to RSS Feed
- Permalink
- Report Inappropriate Content
Adding reference line-Scatter Chart
Hi All,
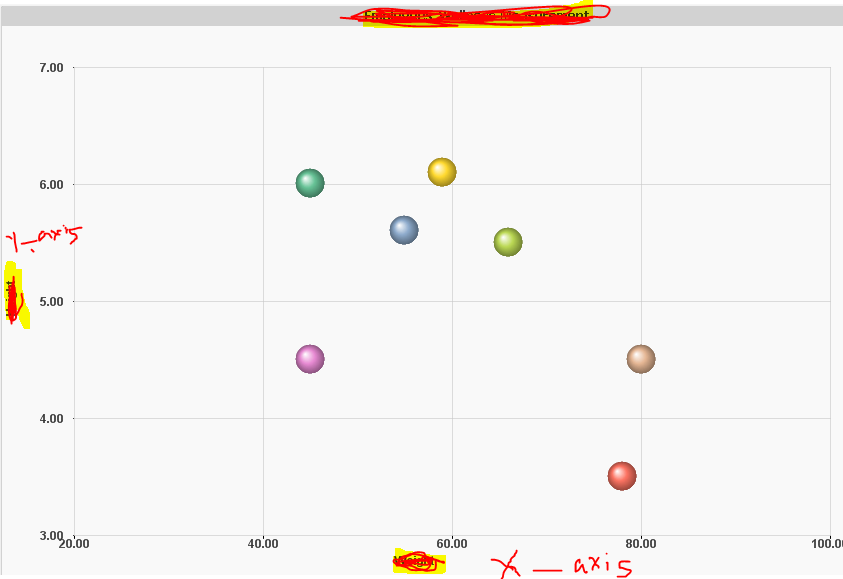
Can anyone suggest me how to add reference line I want it to be in the center horizontally at 5 and vertically at 60.. I don't want to use line. I want it use from chart properties. Can anyone help me out.
I tried this x-axisdimension = 60 and added one more y-axisdimension=5 it not visible.
Regards,
Prajna
- Tags:
- new_to_qlikview
Accepted Solutions
- Mark as New
- Bookmark
- Subscribe
- Mute
- Subscribe to RSS Feed
- Permalink
- Report Inappropriate Content
Hi, you can try this.
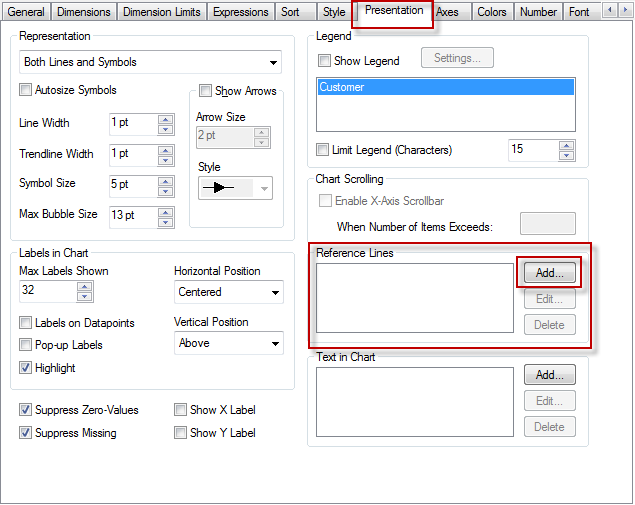
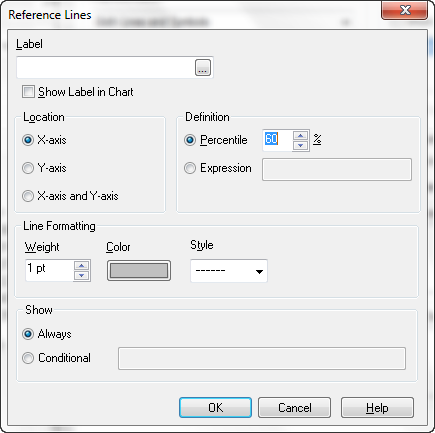
Access the chart properties. Add 2 Reference Lines.
x-axis
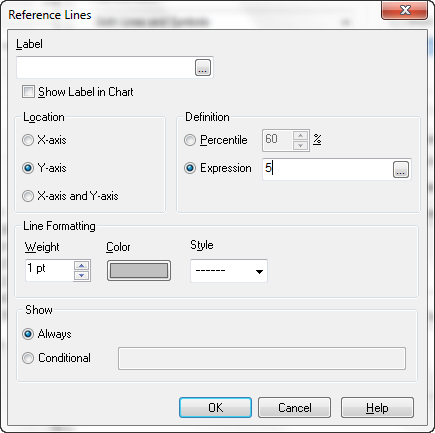
y-axis
Best Regards.
Tonial.
- Mark as New
- Bookmark
- Subscribe
- Mute
- Subscribe to RSS Feed
- Permalink
- Report Inappropriate Content
Hi, you can try this.
Access the chart properties. Add 2 Reference Lines.
x-axis
y-axis
Best Regards.
Tonial.
- Mark as New
- Bookmark
- Subscribe
- Mute
- Subscribe to RSS Feed
- Permalink
- Report Inappropriate Content
Thank you for the solution  I gave value for x-axis as well instead of percentile
I had chosen x and y axis instead of taking x and y separately 
Regards,
Prajna