Unlock a world of possibilities! Login now and discover the exclusive benefits awaiting you.
- Qlik Community
- :
- All Forums
- :
- QlikView App Dev
- :
- Comparison of 2 series in line graph
- Subscribe to RSS Feed
- Mark Topic as New
- Mark Topic as Read
- Float this Topic for Current User
- Bookmark
- Subscribe
- Mute
- Printer Friendly Page
- Mark as New
- Bookmark
- Subscribe
- Mute
- Subscribe to RSS Feed
- Permalink
- Report Inappropriate Content
Comparison of 2 series in line graph
Hi,
Below are the series selection in the list box.
Those series that start with F as below is 2018 Models, while start with E is 2017 Models.
F
FA
FB
FC
E
EA
EB
EC
When F / E selected in the List Box, I wish to see the comparison of line graph between E series & F series, and also quality target of F series. I tried the below expression but it doesn't work well. Please help how to do the automatic selection of the line graph and also the legend title.
If (Series = 'E',
Sum ({<Year ={'2018'},Series={'F'} >}Job)/Sum ({<Year ={'2018'},Series={'F'} >}[Sales Qty]),
If (Series = 'EA',
Sum ({<Year ={'2018'},Series={'FA'} >}Job)/Sum ({<Year ={'2018'},Series={'FA'} >}[Sales Qty]),
If (Series = 'EB',
Sum ({<Year ={'2018'},Series={'FB'} >}Job)/Sum ({<Year ={'2018'},Series={'FB'} >}[Sales Qty]),
If (Series = 'EC,
Sum ({<Year ={'2018'},Series={'FC'} >}Job)/Sum ({<Year ={'2018'},Series={'FC'} >}[Sales Qty]),
Sum ({<FY ={'FY2018'}>}Job)/Sum ({<FY ={'FY2018'}>}[Sales Qty])
))))
Thank you.
- Mark as New
- Bookmark
- Subscribe
- Mute
- Subscribe to RSS Feed
- Permalink
- Report Inappropriate Content
Can you share sample data and expected output?
- Mark as New
- Bookmark
- Subscribe
- Mute
- Subscribe to RSS Feed
- Permalink
- Report Inappropriate Content
If you add another field to your data that contains something to identify which values need to be compared, you can then use that field in set analysis.
In this case, for example, you could add If(Len(Series) = 1, ' ', Right(Series, 1)) as Model. So for EA and FA, this field shows 'A', for EB and FB, this field shows 'B', etc. Except for E and F where the field will simply be blank. You might have to modify this to work for your data if your data is different from your example here.
Your set analysis would then be:
- {1<Series = {'E*'}, Model=p(Model)>} for the line that shows the values for the 2017 models
- {1<Series = {'F*'}, Model=p(Model)>} for the line that shows the values for the 2018 models
You can obviously add any other reqs if necessary, like Year = 2018 in your example. Keep in mind this ignores current selections.
So going off your expressions:
- For E: Sum ({1<Year ={'2018'},Series={'E*'}, Model=p(Model)>}Job)/Sum ({1<Year ={'2018'},Series={'E*'}, Model=p(Model) >}[Sales Qty])
- For F: Sum ({1<Year ={'2018'},Series={'F*'}, Model=p(Model)>}Job)/Sum ({1<Year ={'2018'},Series={'F*'}, Model=p(Model) >}[Sales Qty])
- Quality target for F: Sum({1<Year ={'2018'},Series={'F*'}, Model=p(Model)>} [Quality target field])
I think this should work, if not post your .qvw and sample data and it'll be a bit easier to help.
- Mark as New
- Bookmark
- Subscribe
- Mute
- Subscribe to RSS Feed
- Permalink
- Report Inappropriate Content
Hi,
Attached is the sample qvw files.
Currently I separate all the comparison in different sheet by using set expressions.
I wish to combine all the sheets into one sheet by selecting the series in the list box.
Note: The quality target for each series is different.
Thank you.
- Mark as New
- Bookmark
- Subscribe
- Mute
- Subscribe to RSS Feed
- Permalink
- Report Inappropriate Content
Hey,
It took me a little while, but I think I've solved (most of) it. PFA.
I made a bit of a mess of your dashboard, so you're best off just copying the expressions to the chart in your original document.
I only changed the set analysis in the line chart, not the pie chart/straight table, but if you want the set analysis in those too you should just be able to copy it and adjust the expression to what you want to see (change year and the E/F to what you want).
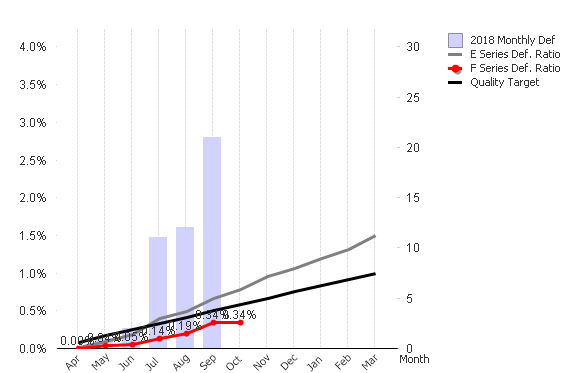
If you select a series, you'll see in the legend that the expression changes to only consider the series you selected and the corresponding series of the year not selected (E/F). Selecting a series also makes the Quality target appear, there is no quality target for the FZ/EZ series as far as I can tell, so there is no target when you select one of those. Same for when nothing is selected.
Something I'm not sure about is the sort order changing when you select a series... If you look at the difference between selecting 'E series' and 'F series' you'll see that the graph matches for the months where there is data for both series, but for some reason the rest of the graph shifts. This probably has something to do with the fact that they aren't in the same year, but I don't know how to fix it. I'll give it another try later but I thought I'd post what I've got so far so maybe someone else can help (or you can solve it).
I've tried a couple selections and they all seem to work, for example select 'EX Series' and you'll see it's the same graph as in the 'FX Series' tab. One difference I found was in the '2018 Monthly def' expression in the FS Series, but that is because in the expression in that tab it looks at 'F Series' instead, and I think that might just be a mistake.
I'll end the wall of text for now, if you run into any problems or have any questions let me know, hope it works! 
EDIT: Just noticed the EZ Series doesn't show up in the graph. This is because of the static max set to 0.04 on both the % expressions. Just turn that off and it'll show up.