Unlock a world of possibilities! Login now and discover the exclusive benefits awaiting you.
- Qlik Community
- :
- All Forums
- :
- QlikView App Dev
- :
- Help Using Rank Function
- Subscribe to RSS Feed
- Mark Topic as New
- Mark Topic as Read
- Float this Topic for Current User
- Bookmark
- Subscribe
- Mute
- Printer Friendly Page
- Mark as New
- Bookmark
- Subscribe
- Mute
- Subscribe to RSS Feed
- Permalink
- Report Inappropriate Content
Help Using Rank Function
Hi,
Can someone help me using Rank function, i have this example but the output is not what i expected :
=aggr(if(rank(
Sum({<
DataType = {'Outsort'}
, YearMonth = {$(=Max(YearMonth))}
, ItemType = {'12'}
, Range = {'XXX'}
>} [Scrapped quantity])
+
Sum({<
DataType = {'Outsort'}
, YearMonth = {$(=Max(YearMonth))}
, ItemType = {'12'}
, Range = {'XXX'}
>} [Sent to Repair quantity])
,4)=1,
Sum({<
DataType = {'Outsort'}
, YearMonth = {$(=Max(YearMonth))}
, ItemType = {'12'}
, Range = {'XXX'}
>} [Scrapped quantity])
+
Sum({<
DataType = {'Outsort'}
, YearMonth = {$(=Max(YearMonth))}
, ItemType = {'12'}
, Range = {'XXX}
>} [Sent to Repair quantity])),[Scrap description])
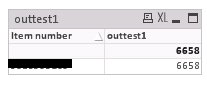
Using this expression i intend to get the quantities of every item with Scrap Description Rank 1, and it actually returns the sum of the total quantity :
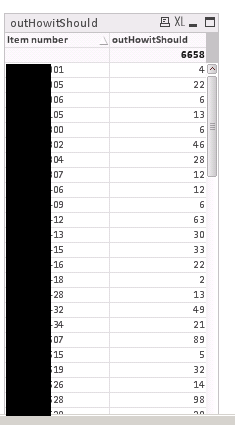
But what i want is to list them by item like this :
Anyone knows how to solve this ?
- « Previous Replies
-
- 1
- 2
- Next Replies »
Accepted Solutions
- Mark as New
- Bookmark
- Subscribe
- Mute
- Subscribe to RSS Feed
- Permalink
- Report Inappropriate Content
So, in your sample... if top chart shows top 2 defects (Broken and Fail)... we would want two charts at the bottom to do the same, right? (let's remove the third chart)
For bottom chart 1... expression
Sum({<Date = {'20180806'}, Defect = {"=Rank(Sum({<Date = {'20180806'}>}QTY)) = 1"}>}QTY)
For bottom chart 2... expression
Sum({<Date = {'20180806'}, Defect = {"=Rank(Sum({<Date = {'20180806'}>}QTY)) = 2"}>}QTY)
You can do the same thing for the next 3 charts....
- Mark as New
- Bookmark
- Subscribe
- Mute
- Subscribe to RSS Feed
- Permalink
- Report Inappropriate Content
Would you be able to share a sample to look and play around with?
- Mark as New
- Bookmark
- Subscribe
- Mute
- Subscribe to RSS Feed
- Permalink
- Report Inappropriate Content
Hi There,
This is part of a company report and i'me not allowed to share it, that's the reason of the black square hidding part of information. I've been told that using the rank function would be possible to reach the expected results but no luck yet ...
Have any idea on what way to go ?
- Mark as New
- Bookmark
- Subscribe
- Mute
- Subscribe to RSS Feed
- Permalink
- Report Inappropriate Content
It looked that you missed the [Item Number] within your calculated dimension and it might be look rather like:
=aggr(if(rank(
Sum({<
DataType = {'Outsort'}
, YearMonth = {$(=Max(YearMonth))}
, ItemType = {'12'}
, Range = {'XXX'}
>} rangesum([Scrapped quantity], [Sent to Repair quantity]))
,4)=1,
[Item Number] & '-' &
Sum({<
DataType = {'Outsort'}
, YearMonth = {$(=Max(YearMonth))}
, ItemType = {'12'}
, Range = {'XXX'}
>} rangesum([Scrapped quantity], [Sent to Repair quantity]))
,[Scrap description])
whereby I'm not sure that the grey part makes much sense - ot should it be a different expression?
- Marcus
- Mark as New
- Bookmark
- Subscribe
- Mute
- Subscribe to RSS Feed
- Permalink
- Report Inappropriate Content
You can anonymize your data.. look here
Preparing examples for Upload - Reduction and Data Scrambling
- Mark as New
- Bookmark
- Subscribe
- Mute
- Subscribe to RSS Feed
- Permalink
- Report Inappropriate Content
Hi Marcus,
Thanks for your reply,
I tried like you said:
=aggr(rank(
Sum({<
DataType = {'Outsort'}
, YearMonth = {$(=Max(YearMonth))}
, ItemType = {'12'}
, Range = {'Kitchen Fronts'}
>} rangesum([Scrapped quantity], [Sent to Repair quantity]))
,4)=1,[Item number] &'-'& [Scrap description])
But it returns "0",
did i miss something?
- Mark as New
- Bookmark
- Subscribe
- Mute
- Subscribe to RSS Feed
- Permalink
- Report Inappropriate Content
Hi Sunny,
Thanks for the info, i actually didn't know about that, but, even for doing it i will have to check if i have permission to do it.
If the report was something plain and simple i would create a similar thing to upload but the problem is that the report is very complex and to send you an example it most contain sensitive data which is "Hardcoded" in some parts of the script and won't show nothing after perform scramble.
I'll try to find a way of share something similar 
But anyway thanks again for the info about data anonymize ...
- Mark as New
- Bookmark
- Subscribe
- Mute
- Subscribe to RSS Feed
- Permalink
- Report Inappropriate Content
Sounds good, sorry not able to offer much help...
- Mark as New
- Bookmark
- Subscribe
- Mute
- Subscribe to RSS Feed
- Permalink
- Report Inappropriate Content
It's not really clear to me what do you want to do?
Your expression should serve as a calculated dimension or as an expression to a dimension? Does the inside-aggregation with the set analysis condition itself work and returning the expected results?
- Marcus
- Mark as New
- Bookmark
- Subscribe
- Mute
- Subscribe to RSS Feed
- Permalink
- Report Inappropriate Content
Hi there, stalwar1 marcus_sommer
Sorry about the late reply ...
I created a similiar example of what i need:
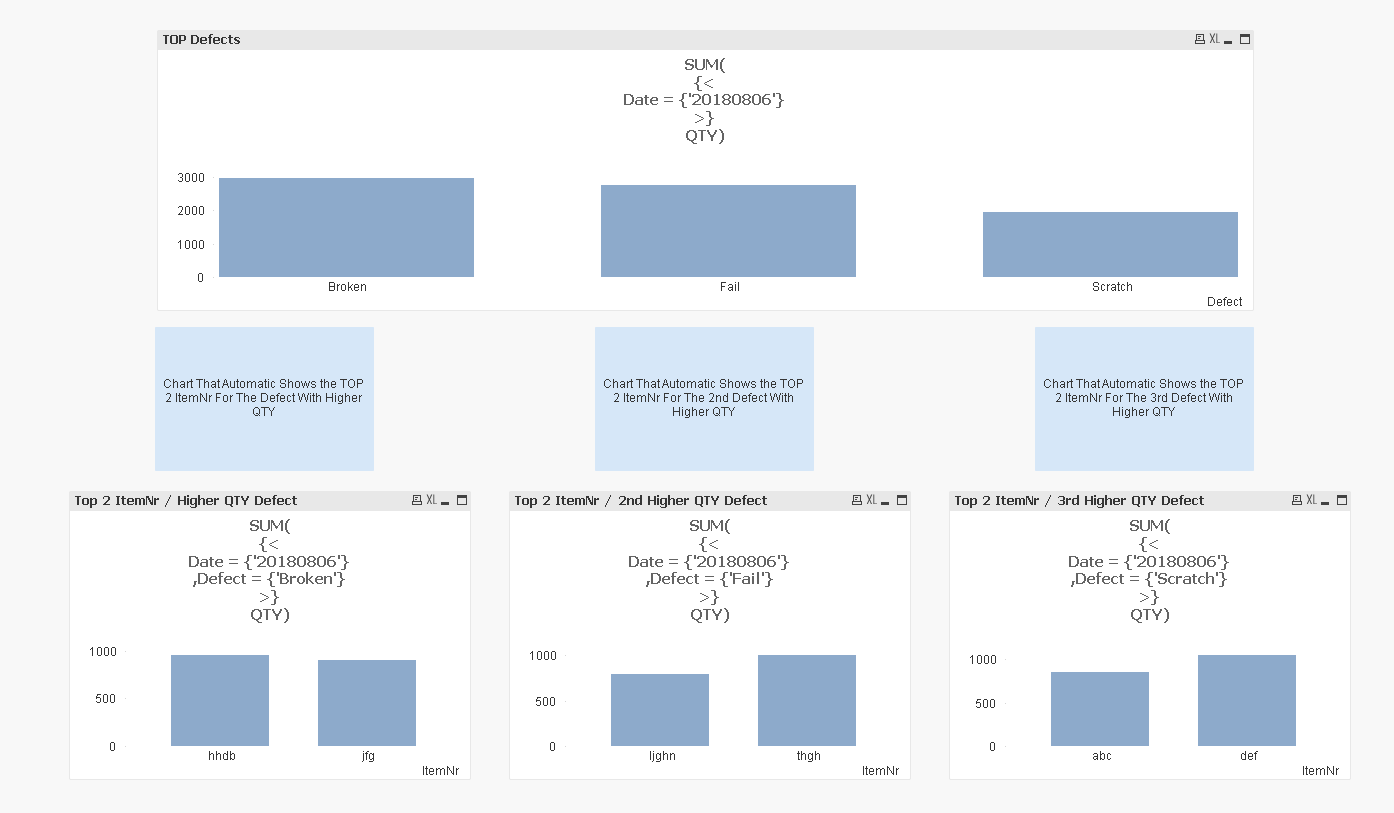
The first chart will show for that specific day the top Defects per QTY, and i need that according to that the 3 other charts automatically show the top 2 ItemNr For each of the top Defects (1st, 2nd and 3rd). I thought that using expression with rank would be the solution but now im not so sure.
The qvw file is attached.
- Eduardo
- « Previous Replies
-
- 1
- 2
- Next Replies »