Unlock a world of possibilities! Login now and discover the exclusive benefits awaiting you.
- Qlik Community
- :
- All Forums
- :
- QlikView App Dev
- :
- Prior Year...on the same row
- Subscribe to RSS Feed
- Mark Topic as New
- Mark Topic as Read
- Float this Topic for Current User
- Bookmark
- Subscribe
- Mute
- Printer Friendly Page
- Mark as New
- Bookmark
- Subscribe
- Mute
- Subscribe to RSS Feed
- Permalink
- Report Inappropriate Content
Prior Year...on the same row
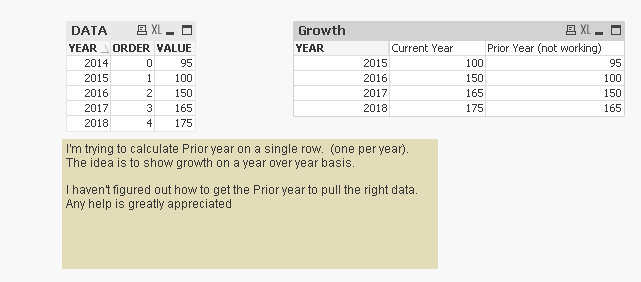
I'm trying to show in a straight table, how one year compares to the prior year. And calculate growth in one line.
given the following example (Attached) here is what I'm trying to achieve
| Year | Amount | Prior Year Amount (Not working) |
|---|---|---|
| 2015 | 100 | 95 |
| 2016 | 150 | 100 |
| 2017 | 165 | 150 |
| 2018 | 175 | 165 |
I thought it would be simple enough to say... SUM({<[Year] = {'=([Year]-1)'}>} Amount)
Example workbook attached.
What am I missing?
Thanks,
Randy
Message was edited by: Randy Kluver Corrected my file... should have data for 2014, but the chart would not show2014, except as the amount in Prior Year for 2015.
Accepted Solutions
- Mark as New
- Bookmark
- Subscribe
- Mute
- Subscribe to RSS Feed
- Permalink
- Report Inappropriate Content
Try this
1) Current Year
Sum({<YEAR = {">=2015"}>} VALUE)
2) Prior Year
Above(Sum({<YEAR>}VALUE)) * Avg(1)
- Mark as New
- Bookmark
- Subscribe
- Mute
- Subscribe to RSS Feed
- Permalink
- Report Inappropriate Content
Try this
Above(Sum(VALUE))
- Mark as New
- Bookmark
- Subscribe
- Mute
- Subscribe to RSS Feed
- Permalink
- Report Inappropriate Content
Quick Update....
in the Data... There would be data for 2014... So the row for 2015 should have a Prior year value in it. (Sorry for not clarifying that earlier).
Should look like this:
DATA:
2014 95
2015 100
...
Chart... Will not Show 2014, but still want to show the Prior Year in 2015
Year Current Year Prior Year
2015 100 95
- Mark as New
- Bookmark
- Subscribe
- Mute
- Subscribe to RSS Feed
- Permalink
- Report Inappropriate Content
Try this
1) Current Year
Sum({<YEAR = {">=2015"}>} VALUE)
2) Prior Year
Above(Sum({<YEAR>}VALUE)) * Avg(1)
- Mark as New
- Bookmark
- Subscribe
- Mute
- Subscribe to RSS Feed
- Permalink
- Report Inappropriate Content
Sunny,
Expanding on that that solution.
I tested and verified that I can use the OFFSET in the ABOVE function to adapt it to fit for using Quarters.
My next question is....
Is there a safeguard to make sure I'm comparing the right Years or Quarters?
Example:
Given Years 2014 - 2019.... a User excludes 2017.
Using ABOVE() would not compensate for that. The solution noted would for 2018 show Prior Year = 2016; not 2017.
Is there a solution using Set Analysis that would ensure or calculate which Year value to return?
Thanks,
Randy
- Mark as New
- Bookmark
- Subscribe
- Mute
- Subscribe to RSS Feed
- Permalink
- Report Inappropriate Content
The best way might be to use The As-Of Table to handle this.
- Mark as New
- Bookmark
- Subscribe
- Mute
- Subscribe to RSS Feed
- Permalink
- Report Inappropriate Content
Hi Sunny,
Thanks for the solution much appreciated. I have modified your expression and used it, It's working when I inlcude just year wise like mentioned in the image below
Previous year data:- Above(Sum({<POLICY_UW_YEAR, PAYTYPE={'PREMIUM'}>}AMOUNT)) * Avg(1)

In my case, I have these many fields in my pviot table, How do I approch, can you help me please
| POLICY NO |
| RENNO |
| POLICY_TYPE |
| CUST_TYPE |
| INSURED |
| CUSTOMER_AGE |
| PERIOD_FROM |
| PERIOD_TO |
| PRODUCT |
| MAKE |
| MODEL |
| MANFYEAR |
| SEATS |
| CYLINDER |
| REG_NO |
| BODY TYPE |
| REPAIR_COND |
| CHASISNO |
| TRAFFIC_NO |
| MOBILE_NO |
| USER_NAME |
| CHANNEL_NAME |
| SOURCE_SYSTEM |