Unlock a world of possibilities! Login now and discover the exclusive benefits awaiting you.
- Qlik Community
- :
- All Forums
- :
- QlikView App Dev
- :
- Sum(TOTAL<dim>Value) in pivot table
- Subscribe to RSS Feed
- Mark Topic as New
- Mark Topic as Read
- Float this Topic for Current User
- Bookmark
- Subscribe
- Mute
- Printer Friendly Page
- Mark as New
- Bookmark
- Subscribe
- Mute
- Subscribe to RSS Feed
- Permalink
- Report Inappropriate Content
Sum(TOTAL<dim>Value) in pivot table
Hi All,
I have a question about the result that gives me the Sum(TOTAL <dim> Value) function in pivot table.
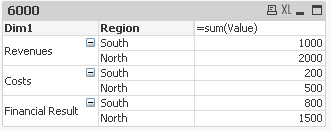
I have data as follow:
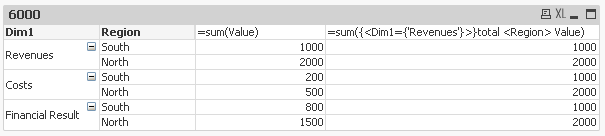
Now I want to present the Revenues value in comparison to other Dim1 values. It should consider the Region. I use the expression:
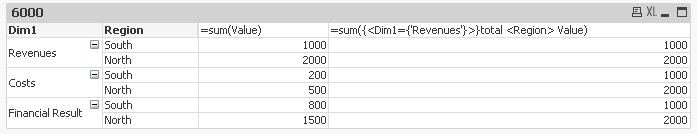
=sum({<Dim1={'Revenues'}>}total <Region> Value)
When the pivot tabel is fully collapsed or fully expanded I get the expected result:

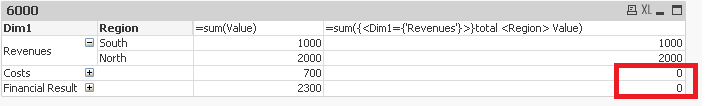
The problem is when Dim1 is partly expanded - then the expression returns 0 for the collapsed values:
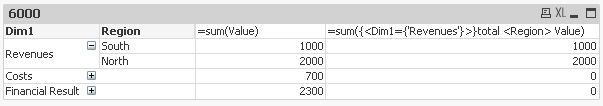
Why is it happen?
Is there a way to present the values properly? How should I correct my expression? (I expected the result of 3000 instead of 0 when the table is not fully expanded)
The source data are:
Table:
LOAD * INLINE [
Dim1, Region, Value
Revenues, South, 1000
Revenues, North, 2000
Costs, South, 200
Costs, North, 500
Financial Result, South, 800
Financial Result, North, 1500
];
Thanks for any help
Regards
Joanna
- Mark as New
- Bookmark
- Subscribe
- Mute
- Subscribe to RSS Feed
- Permalink
- Report Inappropriate Content
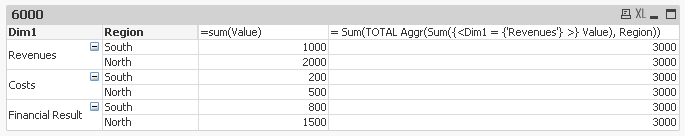
you have to try this:
= Sum(TOTAL Aggr(Sum({<Dim1 = {'Revenues'} >} Value), Region))
So first you are aggregating the Sum value by region Revenues then you are doing a TOTAL of that Revenues.
- Mark as New
- Bookmark
- Subscribe
- Mute
- Subscribe to RSS Feed
- Permalink
- Report Inappropriate Content
Hi,
Thank you for your reply. Unfortunatelly the solution with AGGR function doesn't work as expected. It shows the same value of revenues regardless the dimension.
Your solution gives the result:
But I expect it to look like this:
But the problem is that the values disappear when I collapse the Region dimension like this:
Regards
- Mark as New
- Bookmark
- Subscribe
- Mute
- Subscribe to RSS Feed
- Permalink
- Report Inappropriate Content
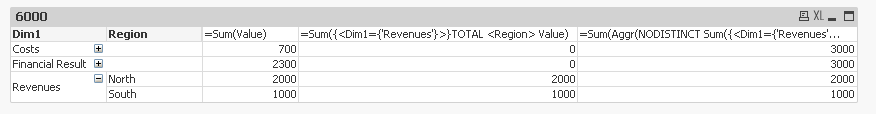
May be try this
=Sum(Aggr(NODISTINCT Sum({<Dim1={'Revenues'}>}TOTAL <Region> Value), Region))