Unlock a world of possibilities! Login now and discover the exclusive benefits awaiting you.
- Qlik Community
- :
- All Forums
- :
- QlikView App Dev
- :
- Null vs 0 in Line Chart
- Subscribe to RSS Feed
- Mark Topic as New
- Mark Topic as Read
- Float this Topic for Current User
- Bookmark
- Subscribe
- Mute
- Printer Friendly Page
- Mark as New
- Bookmark
- Subscribe
- Mute
- Subscribe to RSS Feed
- Permalink
- Report Inappropriate Content
Null vs 0 in Line Chart
The issue I am having is that if the Avg # of days between two selected PROCESS steps is 0, it should show as 0 and not null.
Example: DEFECT_ID = 6036
PROCESS_STEP = Ticket Created and Routed
Expression: SUM(
Aggr(
Max(PROCESS_STEP_START_DATE)- Min(PROCESS_STEP_START_DATE)
,DEFECT_ID)
)
/Count({$<DEFECT_ID = {"=Count(PROCESS_STEP) = GetSelectedCount(PROCESS_STEP)"}>}DISTINCT DEFECT_ID)
You can see from the tables that the data is showing as 0 but is not showing on the line chart. I tried an if(isnull()) but it didn't fix it. Any suggestions?
Accepted Solutions
- Mark as New
- Bookmark
- Subscribe
- Mute
- Subscribe to RSS Feed
- Permalink
- Report Inappropriate Content
- Mark as New
- Bookmark
- Subscribe
- Mute
- Subscribe to RSS Feed
- Permalink
- Report Inappropriate Content
Hi,
try with this:
=if(len(trim(your_field))=0,...
- Mark as New
- Bookmark
- Subscribe
- Mute
- Subscribe to RSS Feed
- Permalink
- Report Inappropriate Content
No change. I think the issue might be 0/1... but it shows as 0 in the table. I noticed that the month/year doesn't populate in the table though. Maybe that's the issue?
if(len(trim(GOV_PROCESS_QUEUE_TAT))=0,SUM(
Aggr(
Max(PROCESS_STEP_START_DATE)- Min(PROCESS_STEP_START_DATE)
,DEFECT_ID)
)
/Count({$<DEFECT_ID = {"=Count(PROCESS_STEP) = GetSelectedCount(PROCESS_STEP)"}>}DISTINCT DEFECT_ID))
- Mark as New
- Bookmark
- Subscribe
- Mute
- Subscribe to RSS Feed
- Permalink
- Report Inappropriate Content
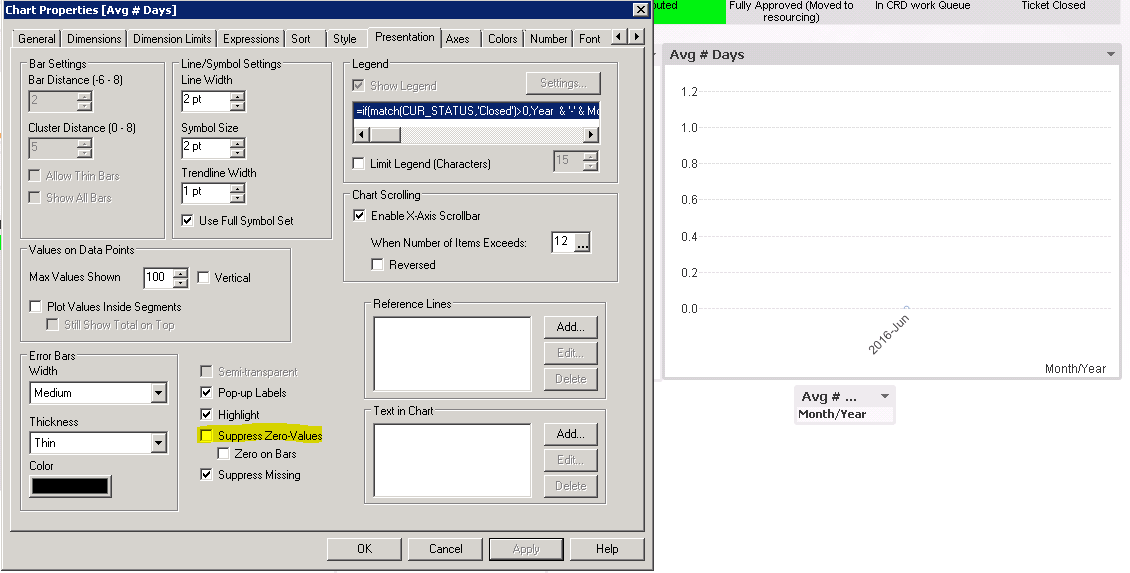
Just uncheck this in your chart properties.
- Mark as New
- Bookmark
- Subscribe
- Mute
- Subscribe to RSS Feed
- Permalink
- Report Inappropriate Content
Duh. Thanks