Unlock a world of possibilities! Login now and discover the exclusive benefits awaiting you.
- Qlik Community
- :
- All Forums
- :
- QlikView App Dev
- :
- Bar Chart: How to show second dimension label unde...
- Subscribe to RSS Feed
- Mark Topic as New
- Mark Topic as Read
- Float this Topic for Current User
- Bookmark
- Subscribe
- Mute
- Printer Friendly Page
- Mark as New
- Bookmark
- Subscribe
- Mute
- Subscribe to RSS Feed
- Permalink
- Report Inappropriate Content
Bar Chart: How to show second dimension label under each bar?
Hi,
I want to create a bar chart where I want to show salary by Title and Office.
Currently chart looks like this:
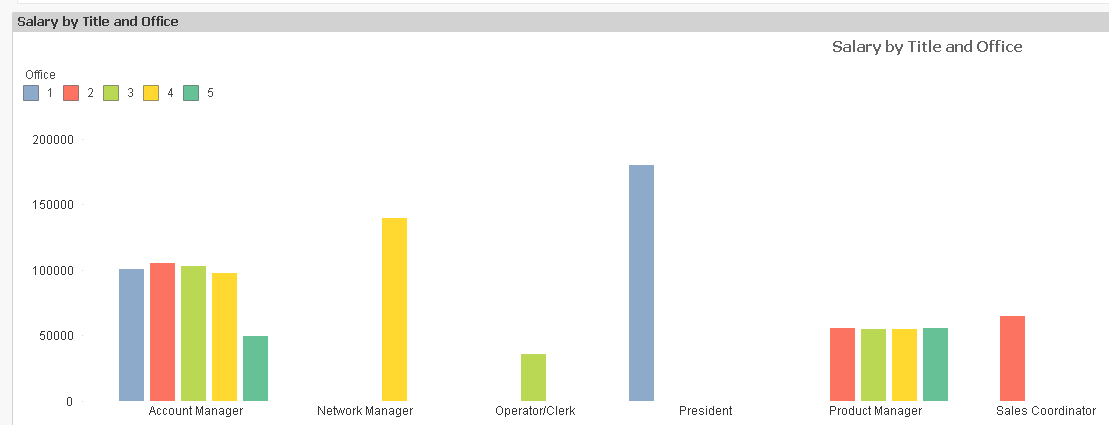
How can I show the office labels under the bar?
I recally QlikView being able to do that in the past but not sure how.
Any suggestions please?
- Mark as New
- Bookmark
- Subscribe
- Mute
- Subscribe to RSS Feed
- Permalink
- Report Inappropriate Content
Add a third dimension, may be just a static 1 and see what it does? Or share your sample qvw to test it out
- Mark as New
- Bookmark
- Subscribe
- Mute
- Subscribe to RSS Feed
- Permalink
- Report Inappropriate Content
Try below.
1.Add another dimension
2.Hide the label and legend of the new dimension
3. Add below script into the back ground color expression.
=if(Office=1,color(1),
if(Office=2,color(2),
if(Office=3,color(3),
if(Office=4,color(4),
if(Office=5,color(5))))))
Please find the attachment for more detail.
- Mark as New
- Bookmark
- Subscribe
- Mute
- Subscribe to RSS Feed
- Permalink
- Report Inappropriate Content
Something like this?
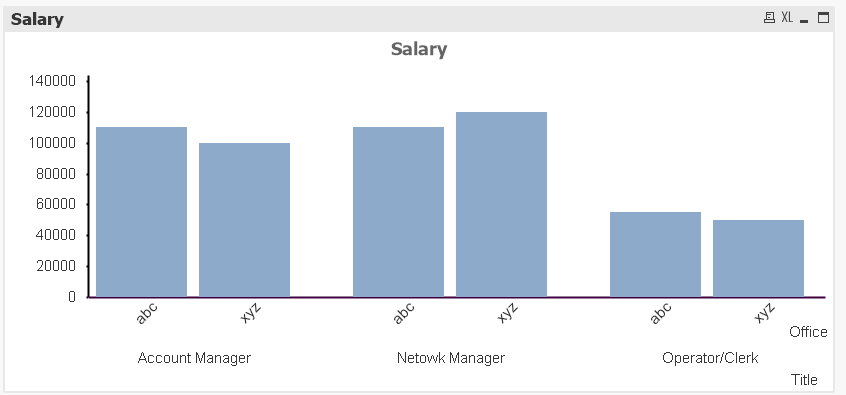
workaround for this is adding a psuedo dimension,but you cannot use more than one expression if you are using 3 dimensions here.check out the qvw attached