Unlock a world of possibilities! Login now and discover the exclusive benefits awaiting you.
- Qlik Community
- :
- All Forums
- :
- QlikView App Dev
- :
- Can I show 2 linecharts in one?
Options
- Subscribe to RSS Feed
- Mark Topic as New
- Mark Topic as Read
- Float this Topic for Current User
- Bookmark
- Subscribe
- Mute
- Printer Friendly Page
Turn on suggestions
Auto-suggest helps you quickly narrow down your search results by suggesting possible matches as you type.
Showing results for
Contributor II
2018-02-24
02:35 AM
- Mark as New
- Bookmark
- Subscribe
- Mute
- Subscribe to RSS Feed
- Permalink
- Report Inappropriate Content
Can I show 2 linecharts in one?
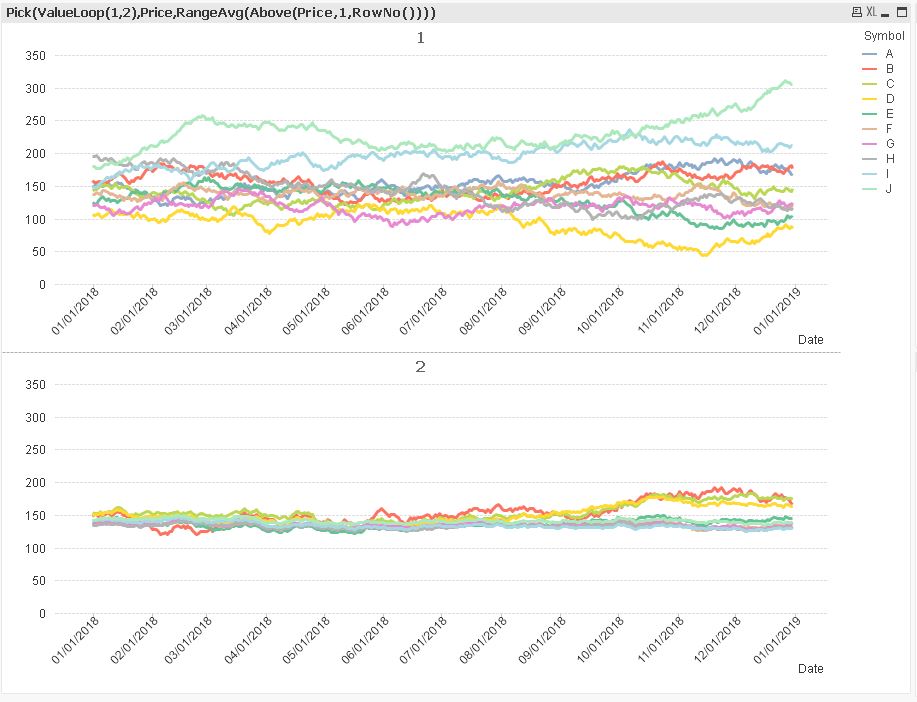
I have 2 linecharts with same dimentions (Date,Symbol) , experssion of one of them is "Price" and the other is "RangeAvg(Above(Price,1,RowNo()))". Can I create a line chart with 2 seperate parts for each experssion (one of them on top and the other on the bottom).
403 Views
2 Replies
Partner Ambassador/MVP
2018-02-24
04:30 AM
- Mark as New
- Bookmark
- Subscribe
- Mute
- Subscribe to RSS Feed
- Permalink
- Report Inappropriate Content
Hi,
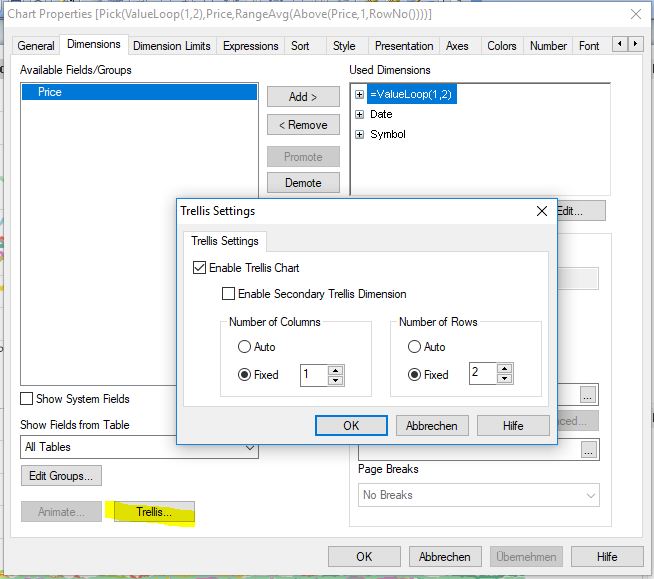
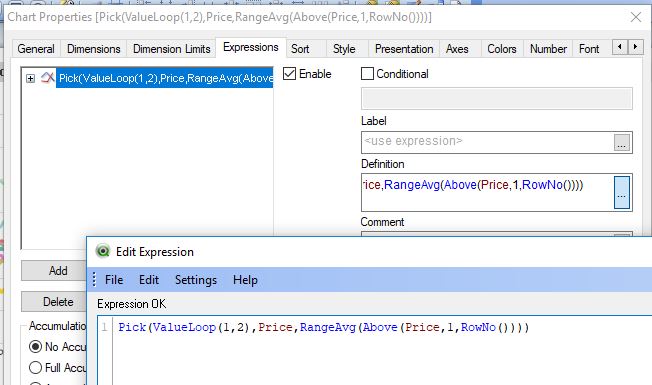
You can just create combo chart which will have your common dimension and expression from both charts.
Place one expression on right axis and other on Left and then select the "Split" option which will split the chart in two parts.
Regards,
Kaushik Solanki
Please remember to hit the 'Like' button and for helpful answers and resolutions, click on the 'Accept As Solution' button. Cheers!
268 Views
MVP
2018-02-24
04:15 PM
- Mark as New
- Bookmark
- Subscribe
- Mute
- Subscribe to RSS Feed
- Permalink
- Report Inappropriate Content
268 Views