Unlock a world of possibilities! Login now and discover the exclusive benefits awaiting you.
- Qlik Community
- :
- All Forums
- :
- QlikView App Dev
- :
- Creating a table with headers and assign the diffe...
- Subscribe to RSS Feed
- Mark Topic as New
- Mark Topic as Read
- Float this Topic for Current User
- Bookmark
- Subscribe
- Mute
- Printer Friendly Page
- Mark as New
- Bookmark
- Subscribe
- Mute
- Subscribe to RSS Feed
- Permalink
- Report Inappropriate Content
Creating a table with headers and assign the different expressions to each column
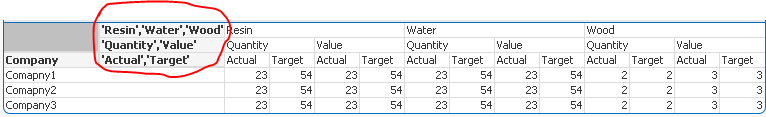
Hello, I have been trying to create the table in the qvw attached (Table1) and use on each of the columns the correct expression. But I can't seem to do it the correct way. I have tried with 'If clauses' but that would be just bad for performance since this is just an example and the table would be bigger. I have also tried with valuelist (Table2 below) but valuelist makes all combinations between given values (eg: Water only has Quantity and not the rest of the metrics), and that's not what I want. What I am looking to do is something like the Table1 where I can assign the expression to each column. Can anyone help me get around this? Thank you.
- « Previous Replies
-
- 1
- 2
- Next Replies »
Accepted Solutions
- Mark as New
- Bookmark
- Subscribe
- Mute
- Subscribe to RSS Feed
- Permalink
- Report Inappropriate Content
Here you are
Dimensions
Company
CostAnalysisH1
CostAnalysisH2
CostAnalysisH3
Expressions
Pick(wildmatch(Only(CostAnalysisH1),$(vCostAnalysisH1)),
Pick(wildmatch(Only(CostAnalysisH2),$(vCostAnalysisH2)),
Pick(wildmatch(Only(CostAnalysisH3),$(vCostAnalysisH3)),1),Pick(wildmatch(Only(CostAnalysisH3),$(vCostAnalysisH3)),2,3)),
Pick(wildmatch(Only(CostAnalysisH2),$(vCostAnalysisH2)),
Pick(wildmatch(Only(CostAnalysisH3),$(vCostAnalysisH3)),4)),
Pick(wildmatch(Only(CostAnalysisH2),$(vCostAnalysisH2)),
Pick(wildmatch(Only(CostAnalysisH3),$(vCostAnalysisH3)),5),Pick(wildmatch(Only(CostAnalysisH3),$(vCostAnalysisH3)),6,7))
)
Variables
=Concat({<CostAnalysisH1, CostAnalysisH2, CostAnalysisH3>}DISTINCT(chr(39)&CostAnalysisH1&chr(39)),',')
=Concat({<CostAnalysisH1, CostAnalysisH2, CostAnalysisH3>}DISTINCT(chr(39)&CostAnalysisH3&chr(39)),',')
=Concat({<CostAnalysisH1, CostAnalysisH2, CostAnalysisH3>}DISTINCT(chr(39)&CostAnalysisH3&chr(39)),',')
- Mark as New
- Bookmark
- Subscribe
- Mute
- Subscribe to RSS Feed
- Permalink
- Report Inappropriate Content
Is this you are expecting?
- Mark as New
- Bookmark
- Subscribe
- Mute
- Subscribe to RSS Feed
- Permalink
- Report Inappropriate Content
Hello, thanks for looking into this. About your reply, that's not what I want. I want something like my Table 1. There I have all values as 1, because I can't seem to appropriately assign the expressions to the columns. For example, in my qvw, I have the metric #QtyActResin which is the value fall under Resin->Quantity->Actual. I tried to do this with IF:
IF(CostAnlysisH1='Resin' and CostAnalysisH2='Quantity' and CostAnalysisH3='Actual', sum(#QtyActResin), ....) and so on. But this will be terrible for performance because the table is very big. Been trying with pick(match()) but I'm not getting it right.
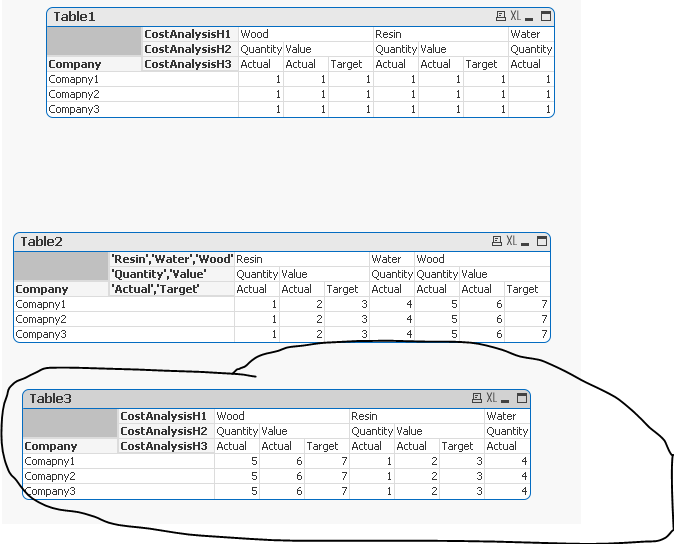
The Table 2, was an attempt to creating something like the Table1 but with valuelist() dimension, instead of the real dimensions, but didn't manage to do it either.
- Mark as New
- Bookmark
- Subscribe
- Mute
- Subscribe to RSS Feed
- Permalink
- Report Inappropriate Content
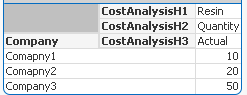
The only difference i can think here is, Using set analysis to achieve and make better job.
Sum({<CostAnalysisH1 = {'Resin'}, CostAnalysisH2 = {'Quantity'}, CostAnalysisH3 = {'Actual'}>} #QtyActResin)
- Mark as New
- Bookmark
- Subscribe
- Mute
- Subscribe to RSS Feed
- Permalink
- Report Inappropriate Content
Tried your suggestion, but it ends putting 0 values for the other expression that is missing on each column.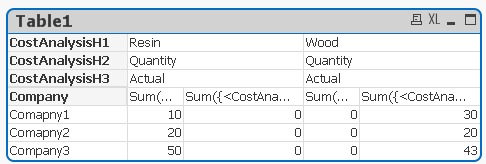
- Mark as New
- Bookmark
- Subscribe
- Mute
- Subscribe to RSS Feed
- Permalink
- Report Inappropriate Content
I just copied that expression in expression section. Due to we added only three filters so it showing as expected
- Mark as New
- Bookmark
- Subscribe
- Mute
- Subscribe to RSS Feed
- Permalink
- Report Inappropriate Content
And What you shown image is correct, This calculates Row level only. So, What are you trying to add here?
- Mark as New
- Bookmark
- Subscribe
- Mute
- Subscribe to RSS Feed
- Permalink
- Report Inappropriate Content
What I want is something that ends up looking like this excel example.

The expression you provided while it works alone, when I start to add more expressions to fill the other columns
they will start to put 0 values on the other columns that they don't fit as my example in the previous post, and that is not what I want.
- Mark as New
- Bookmark
- Subscribe
- Mute
- Subscribe to RSS Feed
- Permalink
- Report Inappropriate Content
I think I might have done it with the valuelist() on my Table 2. But now I wanted to sort it like the Table 1. Any idea how I might achieve this, been trying but nothing is working.
- Mark as New
- Bookmark
- Subscribe
- Mute
- Subscribe to RSS Feed
- Permalink
- Report Inappropriate Content
Since you have already created the dimension in the script... why can't you use this?
Dimensions
Company
CostAnalysisH1
CostAnalysisH2
CostAnalysisH3
Expression
Pick(wildmatch(CostAnalysisH1,$(vCostAnalysisH1)),
Pick(wildmatch(CostAnalysisH2,$(vCostAnalysisH2)),
Pick(wildmatch(CostAnalysisH3,$(vCostAnalysisH3)),1),Pick(wildmatch(CostAnalysisH3,$(vCostAnalysisH3)),2,3)),
Pick(wildmatch(CostAnalysisH2,$(vCostAnalysisH2)),
Pick(wildmatch(CostAnalysisH3,$(vCostAnalysisH3)),4)),
Pick(wildmatch(CostAnalysisH2,$(vCostAnalysisH2)),
Pick(wildmatch(CostAnalysisH3,$(vCostAnalysisH3)),5),Pick(wildmatch(CostAnalysisH3,$(vCostAnalysisH3)),6,7))
)
- « Previous Replies
-
- 1
- 2
- Next Replies »