Unlock a world of possibilities! Login now and discover the exclusive benefits awaiting you.
- Qlik Community
- :
- Forums
- :
- Analytics
- :
- App Development
- :
- Two graphs in one page - each graph with different...
- Subscribe to RSS Feed
- Mark Topic as New
- Mark Topic as Read
- Float this Topic for Current User
- Bookmark
- Subscribe
- Mute
- Printer Friendly Page
- Mark as New
- Bookmark
- Subscribe
- Mute
- Subscribe to RSS Feed
- Permalink
- Report Inappropriate Content
Two graphs in one page - each graph with different GetCurrentSelections?
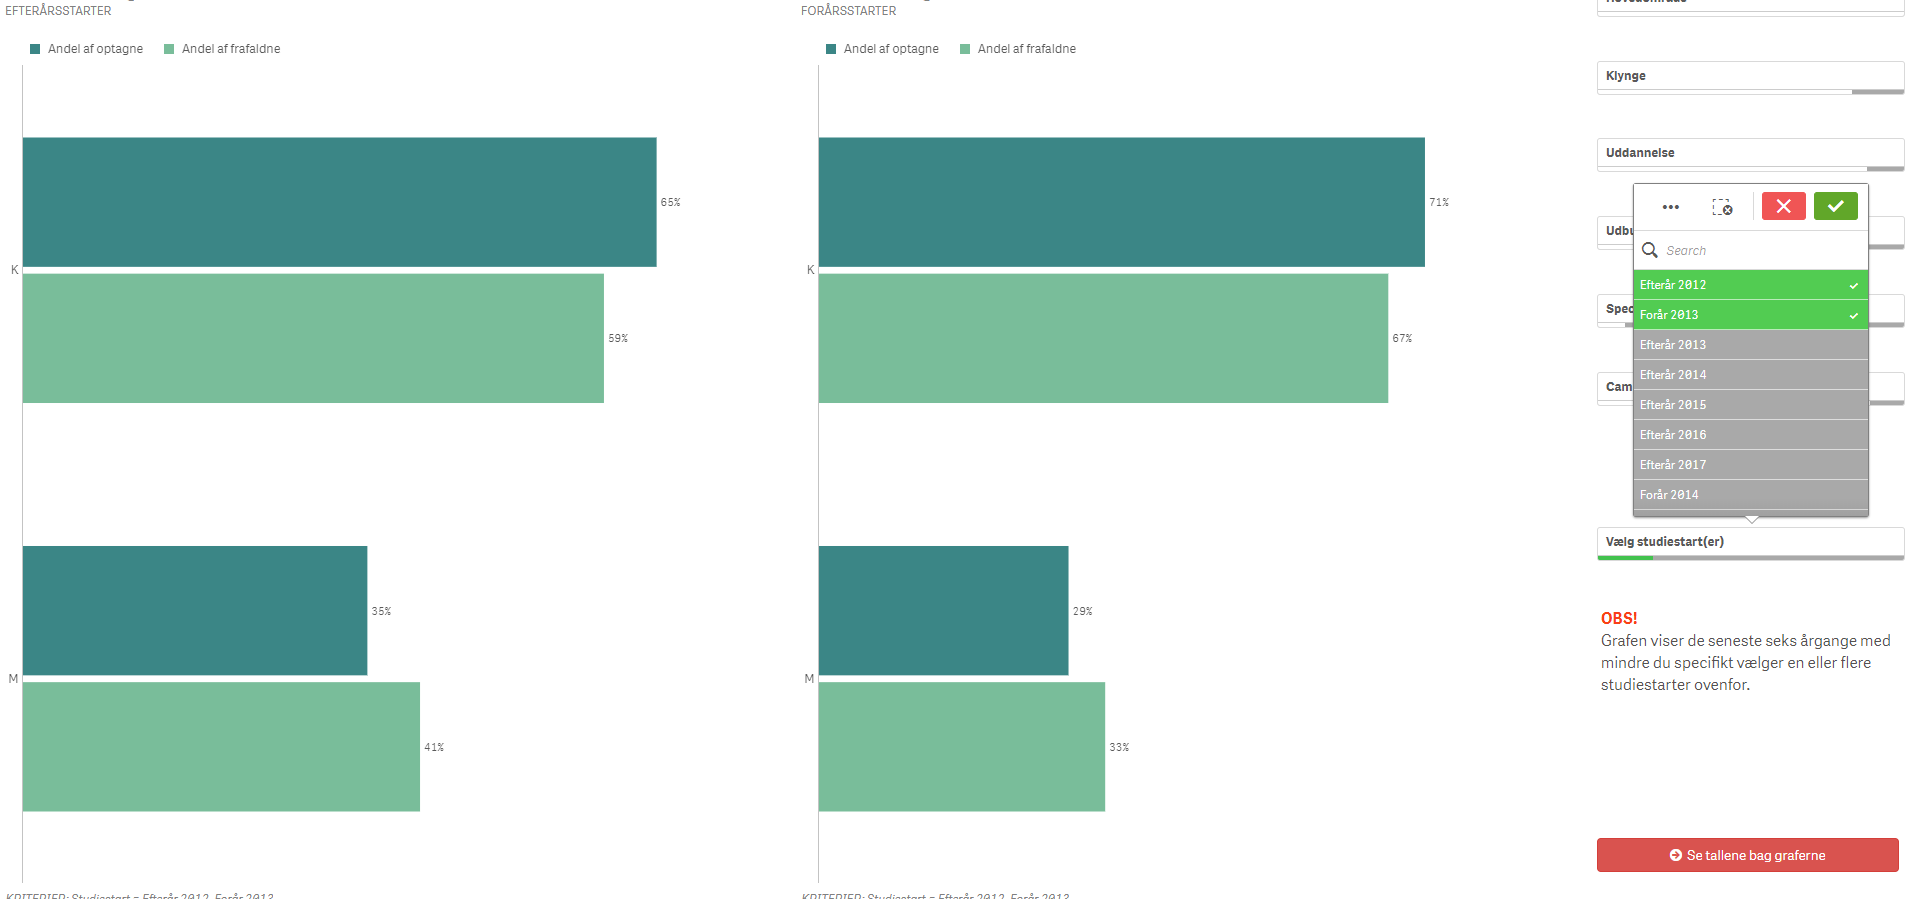
I have a visualization with two bar charts on the same page (see attachment).
One shows data for teams starting in autumn (EFTERÅRSSTARTER in the top of the chart on the left) and the other shows data for teams starting in spring (FORÅRSSTARTER in the top of the chart on the right). That each chart shows these different teams is defined in the measure.
A footnote in each graph shows GetCurrentSelections after "KRITERIER:".
On the right side the user can via the "Vælg studiestart(er)" dropdown choose which specific teams to have depicted in the graphs, for instance "Forår 2013" in the left chart and "Efterår 2012" in the right chart.
Right now the footnote shows both teams in both footnotes (see attachment). In this case I would like the footnote on the graph left to show only "Efterår 2012" and the footnote on the graph right to show only "Forår 2013".
Is this possible?
The name of all teams for the left chart always start with "Efterår" and the name of all teams for the right chart always start with "Forår".