Unlock a world of possibilities! Login now and discover the exclusive benefits awaiting you.
- Qlik Community
- :
- Forums
- :
- Analytics
- :
- New to Qlik Analytics
- :
- Qlik Sense color on expression for measures
Options
- Subscribe to RSS Feed
- Mark Topic as New
- Mark Topic as Read
- Float this Topic for Current User
- Bookmark
- Subscribe
- Mute
- Printer Friendly Page
Turn on suggestions
Auto-suggest helps you quickly narrow down your search results by suggesting possible matches as you type.
Showing results for
Contributor III
2017-11-24
08:52 AM
- Mark as New
- Bookmark
- Subscribe
- Mute
- Subscribe to RSS Feed
- Permalink
- Report Inappropriate Content
Qlik Sense color on expression for measures
Hi,
In Qlik Sense you can color via the dev-hub the sheet objects.
If you go back to desktop en open the chart, I have following expression for color
pick(mod(rank(TOTAL Column(1))-1,2)+1 ,argb(255,0,104,168),argb(255,98,173,45))
you can add more colors for an pie chart,
but I have bar chart with two measures how can I change this code for two measures , if execute this I get this result
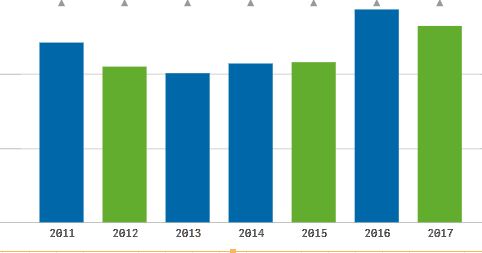
My second measure is a line, so I want the bar in one color and the line in the other color
Best regards
2 Replies
MVP
2017-11-24
08:55 AM
- Mark as New
- Bookmark
- Subscribe
- Mute
- Subscribe to RSS Feed
- Permalink
- Report Inappropriate Content
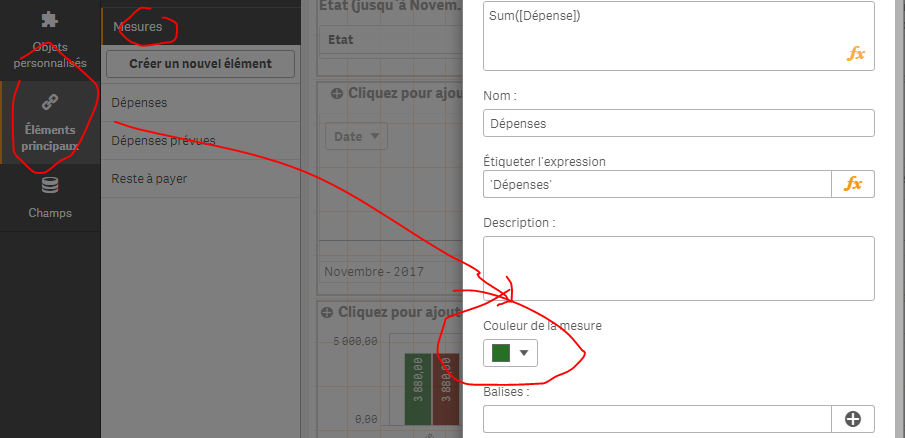
Create your 2 measures as master measures and assign the color to each measure there:
429 Views
Contributor III
2017-11-24
09:38 AM
Author
- Mark as New
- Bookmark
- Subscribe
- Mute
- Subscribe to RSS Feed
- Permalink
- Report Inappropriate Content
Thanks Omar
Community Browser