Unlock a world of possibilities! Login now and discover the exclusive benefits awaiting you.
- Qlik Community
- :
- All Forums
- :
- QlikView App Dev
- :
- Problem of showing dimension title in line chart d...
- Subscribe to RSS Feed
- Mark Topic as New
- Mark Topic as Read
- Float this Topic for Current User
- Bookmark
- Subscribe
- Mute
- Printer Friendly Page
- Mark as New
- Bookmark
- Subscribe
- Mute
- Subscribe to RSS Feed
- Permalink
- Report Inappropriate Content
Problem of showing dimension title in line chart dimension
Hi,
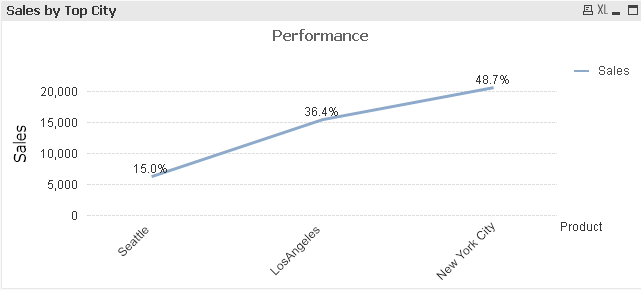
I want to see the 'Sales' text at the Y axis along side the Y axis:
instead of showing the 'Sales' label horizontally like the below screen:

How to achieve this?
Accepted Solutions
- Mark as New
- Bookmark
- Subscribe
- Mute
- Subscribe to RSS Feed
- Permalink
- Report Inappropriate Content
Add a single space your first expression and see if that works for you
- Mark as New
- Bookmark
- Subscribe
- Mute
- Subscribe to RSS Feed
- Permalink
- Report Inappropriate Content
Perhaps this?
- Mark as New
- Bookmark
- Subscribe
- Mute
- Subscribe to RSS Feed
- Permalink
- Report Inappropriate Content
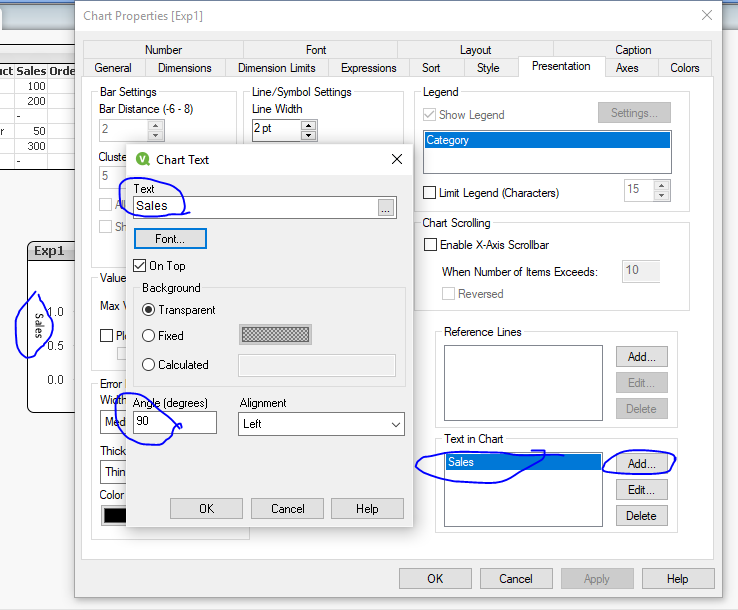
Hi,
I just changed the degree to 270, and it works for me.Below is the reference:
%
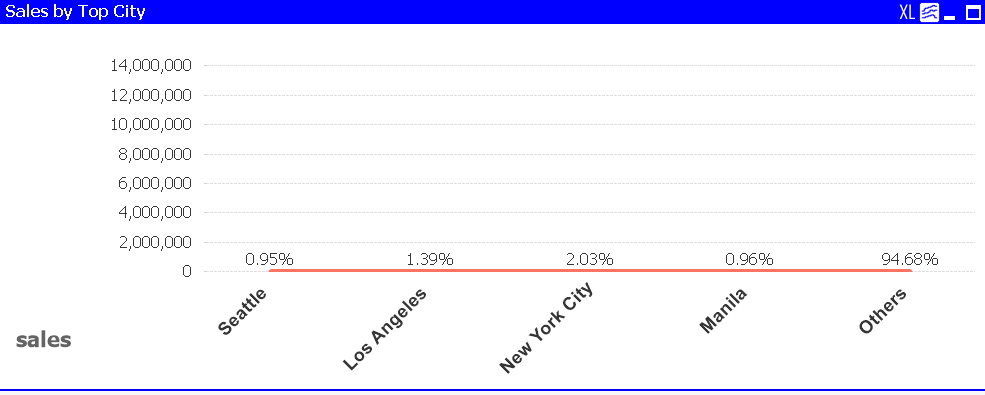
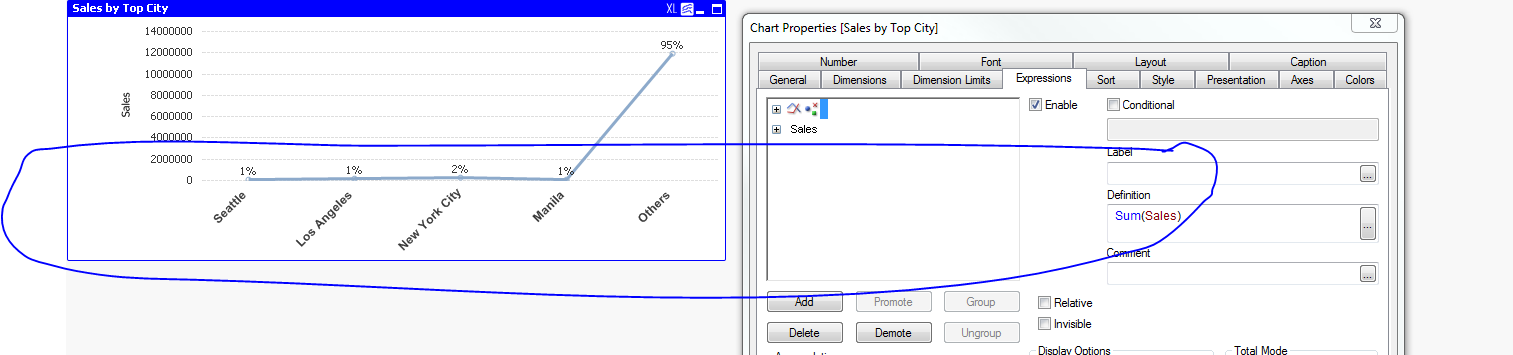
But you can see that sales % are showing as a flat line, instead of showing up and down. So my requirement is:
in left side means in Y axis it should show Sum(Sales), instead of %(percentage) value and in the chart value it should show % values.
So to achieve this goal, I use 2 expression: Sum(Sales) and makes this invisible and other expression is Sum(Sales) with relative values. But my chart is not showing correctly. WHat should I do now?
- Mark as New
- Bookmark
- Subscribe
- Mute
- Subscribe to RSS Feed
- Permalink
- Report Inappropriate Content
Not entirely sure your intend over reply. But, What i understand is instead "Sales" you are going to see "Percentage". Can you attach sample application to look and let us know your end result to see?
- Mark as New
- Bookmark
- Subscribe
- Mute
- Subscribe to RSS Feed
- Permalink
- Report Inappropriate Content
Can you try by creating 2 expressions as follows
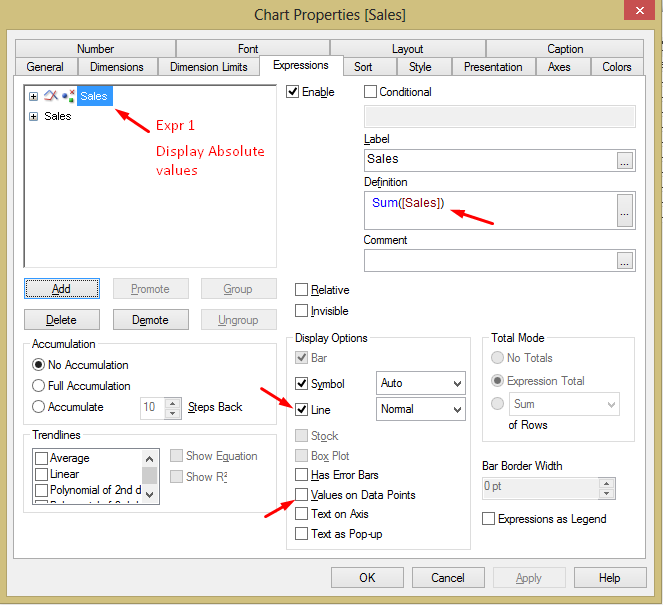
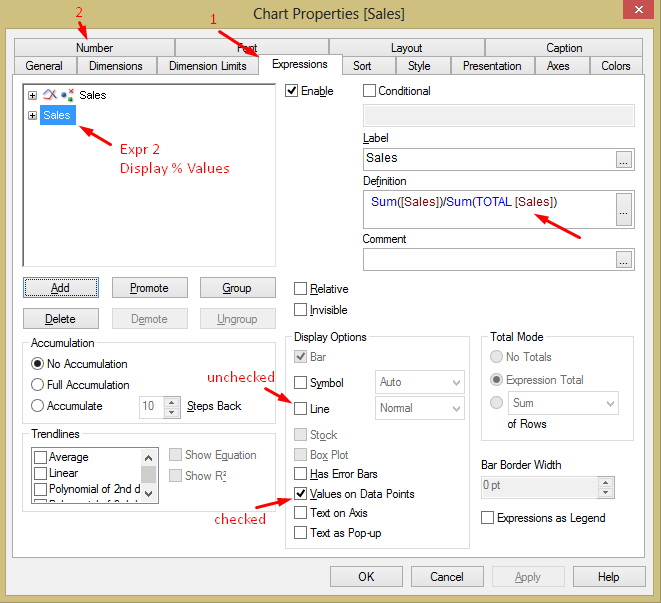
Number Format: 1st Expr -> Expression Default values & 2nd Expr Expression show in %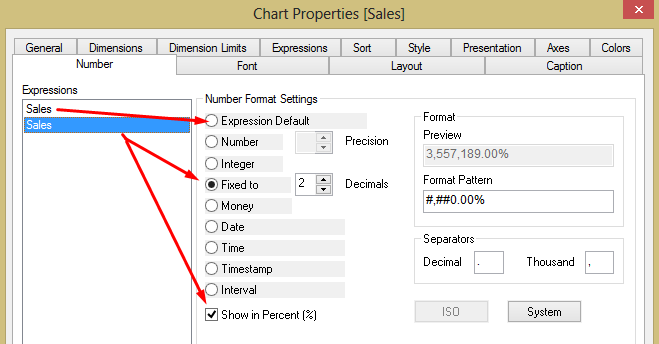
- Mark as New
- Bookmark
- Subscribe
- Mute
- Subscribe to RSS Feed
- Permalink
- Report Inappropriate Content
Hi,
I have uploaded my QVW file and I have achieved the goal that I need to do, but I can't hide the Y axis Label like the below screenshot
So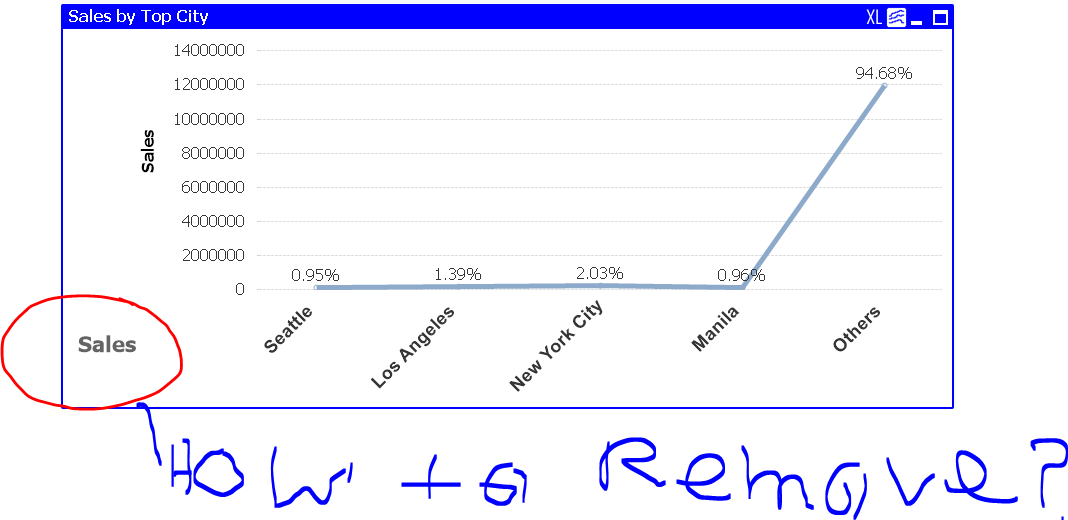
SO If I want to remove the Axis label it is coming like this sum(Sales). So how achieve this?
- Mark as New
- Bookmark
- Subscribe
- Mute
- Subscribe to RSS Feed
- Permalink
- Report Inappropriate Content
In my example it's not visible
- Mark as New
- Bookmark
- Subscribe
- Mute
- Subscribe to RSS Feed
- Permalink
- Report Inappropriate Content
Hi,
In measure section , If i remove label title it just showing as sum(sales), instead of showing only 'Sales', but if i use Sales, it just showing it at Y axis. What I have to do to hide this label?
- Mark as New
- Bookmark
- Subscribe
- Mute
- Subscribe to RSS Feed
- Permalink
- Report Inappropriate Content
Add a single space your first expression and see if that works for you