Unlock a world of possibilities! Login now and discover the exclusive benefits awaiting you.
- Qlik Community
- :
- All Forums
- :
- QlikView App Dev
- :
- Correct way to describe a chart->listbox dimensio...
- Subscribe to RSS Feed
- Mark Topic as New
- Mark Topic as Read
- Float this Topic for Current User
- Bookmark
- Subscribe
- Mute
- Printer Friendly Page
- Mark as New
- Bookmark
- Subscribe
- Mute
- Subscribe to RSS Feed
- Permalink
- Report Inappropriate Content
Correct way to describe a chart->listbox dimension by month name
I am trying to do the following:
1) Create a chart->list box.
2) I am going to click the horizontal property on the presentation.
3) On the page I have a start date (say, July 19, 1017) and an end date (say Nov. 22, 2017).
4) Have a number of expressions that list data counts of different things between those two date ranges.
5) I want to show those counts for each of the months from the start date month to the end date month, so in my case, 5 columns
July 2017, Aug 2017, Sep. 2017, Oct 2017 and Nov 2017
6) I have tried an expression for the dimension of ='>=' & Date(vStartDate) & '<=' & Date(vEndDate) and then
='>=' & monthname(Date(vStartDate) & '<=' & Date(vEndDate)) but whenever I say ok to this, qlikview grayw out my listbox while it attempts to calculate things. And if it finishes, nothing is correct.
I feel I am close on the calculation, but need some help, or a reference to something in youtube that might help
Thank you
Message was edited by: Arnold Bearak Enclosed is a sample qvw file. I have to chart-> listboxes. The one by offer is all set. The one I am having a problem with is the 'Test Results by date. What I would like to have is 5 columns by months 7-17 8-17 9-17 10-17 11-17 with the results for each month shown for the 3 categories of stats with the counts for just that month. So that the total value of the combined months matches the number in the total column. Hope this additional information yields to more information.
- « Previous Replies
- Next Replies »
- Mark as New
- Bookmark
- Subscribe
- Mute
- Subscribe to RSS Feed
- Permalink
- Report Inappropriate Content
One way is to use an Aggr() like this:
=Aggr(Only({<DateField = {">='$(vStartDate)' <='$(vEndDate)'"}>} DateField), DateField)
DateField is a place holder - use your date field name here.
If DateField contains more than one date per month, and you want a month listbox, then something like
=Date(MonthStart(Aggr(Only({<DateField = {">='$(vStartDate)' <='$(vEndDate)'"}>} DateField), DateField)), 'MMM yyyy')
- Mark as New
- Bookmark
- Subscribe
- Mute
- Subscribe to RSS Feed
- Permalink
- Report Inappropriate Content
hi,
thank you for the quick response. However, either equation I tried yielded only the over all totals column for me plus just one other column that matched the overall totals.
What I am looking for in the result is something like (fake numbers below) My dates were July 19 to Nov 23 and I did horizontal check box and the equation is the dimension
Total Jul 2017 Aug 2017 Sept 2017 Oct 2017 Nov 2017
Field X sum 20 120 10007 103 5000 2000 3000
Field y sum 40 120 20007 103 5000 2000 3000 etc etc
Arnie Bearak
abearak@identityForce.com
IdentityForce
Phone: 781 367 9991
"Books are of no use unless they are Read".
- Mark as New
- Bookmark
- Subscribe
- Mute
- Subscribe to RSS Feed
- Permalink
- Report Inappropriate Content
I suggest that you upload a small sample qvw with representative data and a full description of the output you require. The data does not have to real, but it should represent your data structure.
- Mark as New
- Bookmark
- Subscribe
- Mute
- Subscribe to RSS Feed
- Permalink
- Report Inappropriate Content
I have added a sample qvw file to the original post. Hope this helps.
Regards,
Arnie
- Mark as New
- Bookmark
- Subscribe
- Mute
- Subscribe to RSS Feed
- Permalink
- Report Inappropriate Content
Jonathan,
I have uploaded the qvw. Wondering if you could look at it and provide me some pointers.
Thanks,
Arnie
- Mark as New
- Bookmark
- Subscribe
- Mute
- Subscribe to RSS Feed
- Permalink
- Report Inappropriate Content
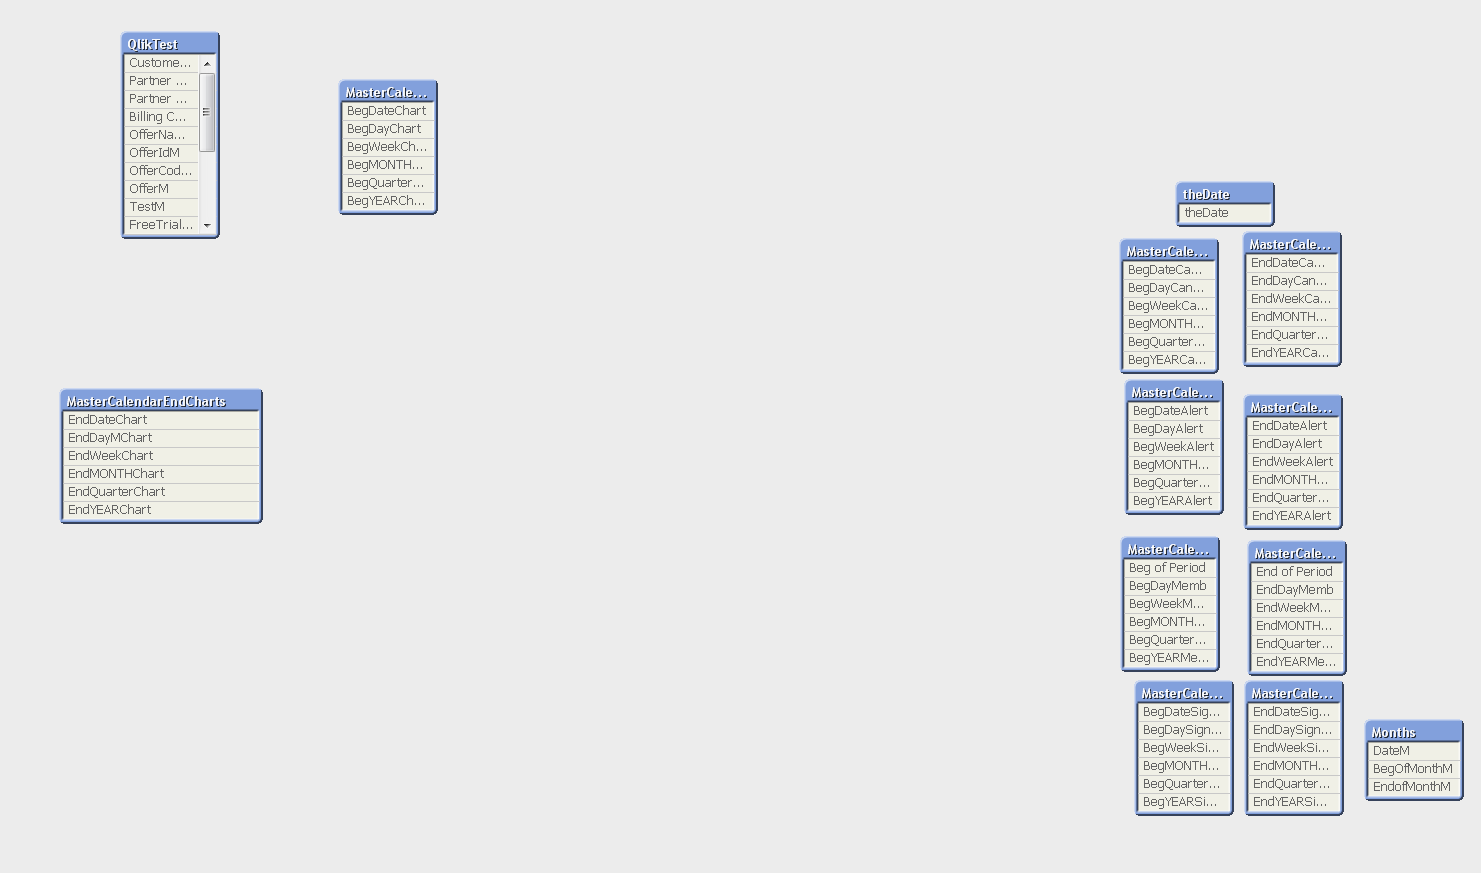
This is a strange data model where none of table is connected to another table in your dashboard. Is this how the sample is or is this how your actual data model also look like?
- Mark as New
- Bookmark
- Subscribe
- Mute
- Subscribe to RSS Feed
- Permalink
- Report Inappropriate Content
In my simplification of what I am presenting, I forgot to remove all of the various master calendars that were part of my larger qvw file. The only real master calendar that I care about is the Beg of Period and the End of Period in order to set my date ranges over which I want to calculate my data results.
So, then I want to be able to use those the Beg of Period and End of Period as the reference dates for my calculations. So if you look at the variable 'vActiveInPeriod'
Sum((IF (TestM = 0, IF (EnabledM, IF (SignupDateM <= [End of Period], 1, 0), 0),0)) + (If (TestM = 1, IF (EnabledM = 0, IF (idCancellationLogM > 0, If (SignupDateM <= [End of Period], IF (CancelDate2M > EndDateAlert, 1, 0),0),0),0),0)))
It is checking the signupDateM and the CancelDate2M dates against the BoP and EoP dates.
As well, the 'vNewInPeriod' variable,
sum(If (TestM = 0,if (SignupDateM >= [Beg of Period], if (SignupDateM <= [End of Period], 1, 0),0),0))
is only looking at the vSignupDateM expression.
Does that help make more sense with this ?
Thank you, Arnie
- Mark as New
- Bookmark
- Subscribe
- Mute
- Subscribe to RSS Feed
- Permalink
- Report Inappropriate Content
So, are you saying that these are the only three tables you care about (for this current problem)?
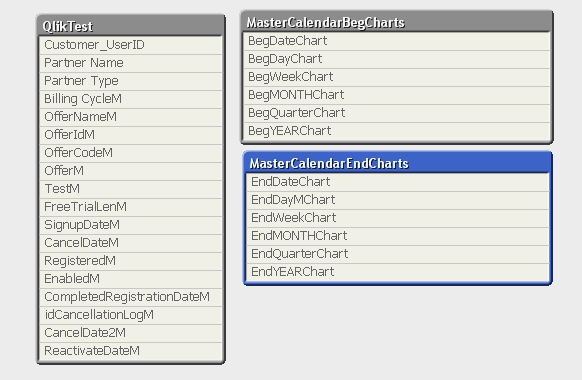
But even these are not connected? I think you need to make a connection between your calendar and master table. Why is there no connection?
- Mark as New
- Bookmark
- Subscribe
- Mute
- Subscribe to RSS Feed
- Permalink
- Report Inappropriate Content
This could be the thing that I am missing.
I am not sure how to connect the BoP and the Eop Calendars to my 3rd table. I thought that the variables I am using for the two fields that have a date made that connection, although, that might be considered an indirect connection.
How would I make a direct connection?
Any assistance would be helpful.
Thanks
- « Previous Replies
- Next Replies »