Unlock a world of possibilities! Login now and discover the exclusive benefits awaiting you.
- Qlik Community
- :
- All Forums
- :
- QlikView App Dev
- :
- Range sum with above function
- Subscribe to RSS Feed
- Mark Topic as New
- Mark Topic as Read
- Float this Topic for Current User
- Bookmark
- Subscribe
- Mute
- Printer Friendly Page
- Mark as New
- Bookmark
- Subscribe
- Mute
- Subscribe to RSS Feed
- Permalink
- Report Inappropriate Content
Range sum with above function
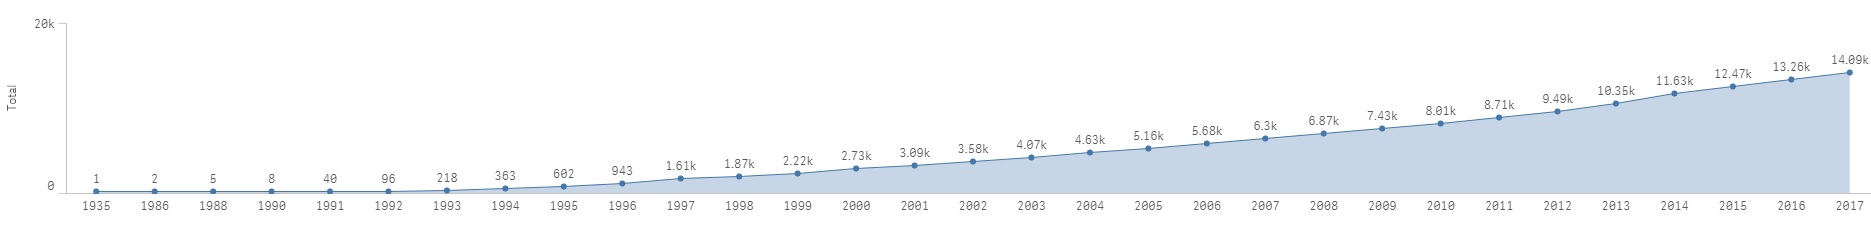
Hi folks,
Refer above line chart. Im using range sum with above function. How can we use range sum with above function but limit the years to show only top 5 years say from 2012 to 2017. 2012 sum would be the total from the start year up to 2012.
Accepted Solutions
- Mark as New
- Bookmark
- Subscribe
- Mute
- Subscribe to RSS Feed
- Permalink
- Report Inappropriate Content
May be multiply you expression with this
Avg({<Year = {"$(='>=' & (Max(Year) - 5) & '<=' & Max(Year))"}>} 1)
- Mark as New
- Bookmark
- Subscribe
- Mute
- Subscribe to RSS Feed
- Permalink
- Report Inappropriate Content
May be multiply you expression with this
Avg({<Year = {"$(='>=' & (Max(Year) - 5) & '<=' & Max(Year))"}>} 1)
- Mark as New
- Bookmark
- Subscribe
- Mute
- Subscribe to RSS Feed
- Permalink
- Report Inappropriate Content
Hi Sunny,
Really appreciate your answer but I am not so sure how am i going to incorporate your solution into my current expression below
Expression
Rangesum(above(count(Company_no),0,RowNo()))
Thank you in advance
- Mark as New
- Bookmark
- Subscribe
- Mute
- Subscribe to RSS Feed
- Permalink
- Report Inappropriate Content
Just this
RangeSum(Above(Count({<Year>}Company_no),0,RowNo())) * Avg({<Year = {"$(='>=' & (Max(Year) - 5) & '<=' & Max(Year))"}>} 1)
- Mark as New
- Bookmark
- Subscribe
- Mute
- Subscribe to RSS Feed
- Permalink
- Report Inappropriate Content
Hi Sunny.
Your solution works great. Love it. One last question, how can we get the chart to only display those 2012 and above data? get rid of those empty year values.
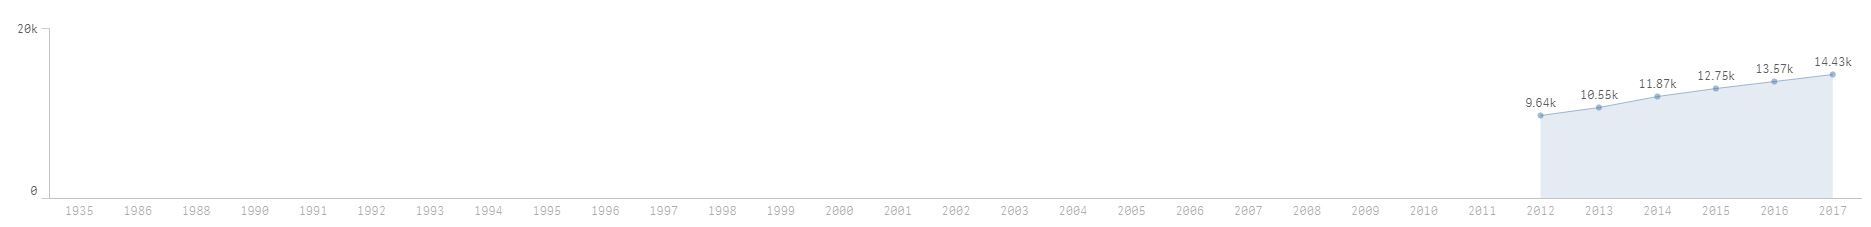
Again, thank you very much for your professional help.
- Mark as New
- Bookmark
- Subscribe
- Mute
- Subscribe to RSS Feed
- Permalink
- Report Inappropriate Content
Hi Sunny, I figured it out. Just unchecked the include zero values. Thanks again for your lovely solution.
- Mark as New
- Bookmark
- Subscribe
- Mute
- Subscribe to RSS Feed
- Permalink
- Report Inappropriate Content
Superb 
- Mark as New
- Bookmark
- Subscribe
- Mute
- Subscribe to RSS Feed
- Permalink
- Report Inappropriate Content
Please close the thread by marking the correct response.
Best,
Sunny