Unlock a world of possibilities! Login now and discover the exclusive benefits awaiting you.
- Qlik Community
- :
- All Forums
- :
- QlikView App Dev
- :
- Stacked Bar Chart - 1 dimension, 2 expressions
- Subscribe to RSS Feed
- Mark Topic as New
- Mark Topic as Read
- Float this Topic for Current User
- Bookmark
- Subscribe
- Mute
- Printer Friendly Page
- Mark as New
- Bookmark
- Subscribe
- Mute
- Subscribe to RSS Feed
- Permalink
- Report Inappropriate Content
Stacked Bar Chart - 1 dimension, 2 expressions
Hello everyone,
Simple question I hope. I have 1 dimension (AGE) and two expressions. When I turn my table into a stacked bar chart it stacks the expressions witht the dimension on the x-axis. What I want is the two expressions as bars stacked by the age groups in the dimension (i.e. I need to flip it)
How do I do this? I can't find a setting to flip it.
Cheers,
Gareth
- Tags:
- stacked_bar_charts
- « Previous Replies
-
- 1
- 2
- Next Replies »
- Mark as New
- Bookmark
- Subscribe
- Mute
- Subscribe to RSS Feed
- Permalink
- Report Inappropriate Content
Go to Properties -> Style -> Subtype and choose "Stacked"
HTH
Peter
- Mark as New
- Bookmark
- Subscribe
- Mute
- Subscribe to RSS Feed
- Permalink
- Report Inappropriate Content
Hi Peter,
Thanks for your example, although it is the wrong way around. I have a single dimension and two expressions. I need the expressions on the x axis and the stacking 'factor' to be the dimension (AGE).
So in your example, Sum(Persons) would be one expression and perhaps Count(Persons) is another expression with a single dimension of AGE.
See the attached, I need the age to be the stack and the expressions to be the bars. Opposite to what I've got in the example.
Thanks
Gareth
- Mark as New
- Bookmark
- Subscribe
- Mute
- Subscribe to RSS Feed
- Permalink
- Report Inappropriate Content
Can you draw it and post it?
Or do you need to have the bars horizontally?
Peter
attachment added
- Mark as New
- Bookmark
- Subscribe
- Mute
- Subscribe to RSS Feed
- Permalink
- Report Inappropriate Content
Here is an example of what I mean with the Dimension of GENDER where the two expressions are on the x axis and the dimension is the stacking factor.
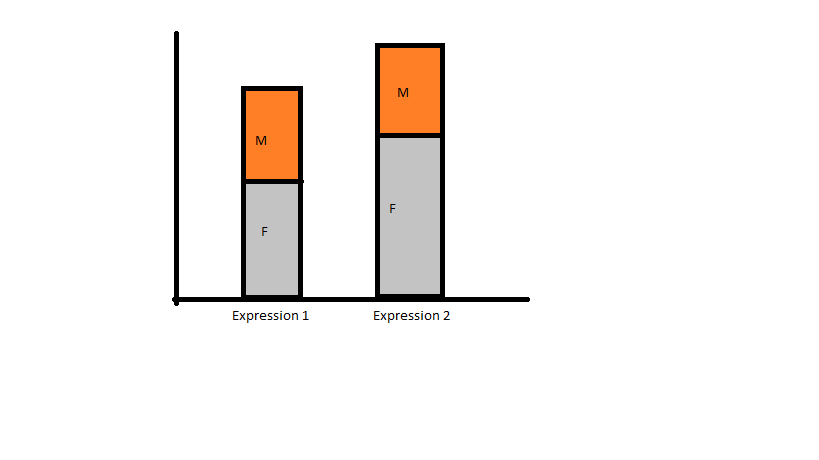
Thanks
Gareth
- Mark as New
- Bookmark
- Subscribe
- Mute
- Subscribe to RSS Feed
- Permalink
- Report Inappropriate Content
Like the attached?
Peter
- Mark as New
- Bookmark
- Subscribe
- Mute
- Subscribe to RSS Feed
- Permalink
- Report Inappropriate Content
Thanks for your reply again Peter.
Unfortunately your example remains a 2x dimension 1x expression. I need to show one with 1x dimension (AGE) and 2xexpressions side-by-side.
Thanks
Gareth
- Mark as New
- Bookmark
- Subscribe
- Mute
- Subscribe to RSS Feed
- Permalink
- Report Inappropriate Content
Hi, Gareth
I tried something with valuelist(). Basically I created a dummy dimension, the multiple expressions as an if statement within the single expression I have.
Hope this can help,
Erich
- Mark as New
- Bookmark
- Subscribe
- Mute
- Subscribe to RSS Feed
- Permalink
- Report Inappropriate Content
Thanks mate, this is a clever workaround!
Cheers
G
- Mark as New
- Bookmark
- Subscribe
- Mute
- Subscribe to RSS Feed
- Permalink
- Report Inappropriate Content
Hello i was wondering if anyone could help me with a problem.
I am trying to stack a bar cahrt with two dimensions and one expression.
The reason for this is because i have a list box which allows me to select 1+ feilds, which are then displayed on the chart according to the dimensions. I can get the bars to stand side by side and horizonaly, but they take up to much space, i cant get them to stack.
When i go into properties and change the style to stacked the data disappears, however if i put it on a line graph the data is displayed as a number of different lines and works, unfortunatly i need it as a bar chart.
Any ideas how i could do this? or if it can even be done?
- « Previous Replies
-
- 1
- 2
- Next Replies »