Unlock a world of possibilities! Login now and discover the exclusive benefits awaiting you.
- Qlik Community
- :
- All Forums
- :
- QlikView App Dev
- :
- How to create a grouped bubble 'line' chart
- Subscribe to RSS Feed
- Mark Topic as New
- Mark Topic as Read
- Float this Topic for Current User
- Bookmark
- Subscribe
- Mute
- Printer Friendly Page
- Mark as New
- Bookmark
- Subscribe
- Mute
- Subscribe to RSS Feed
- Permalink
- Report Inappropriate Content
How to create a grouped bubble 'line' chart
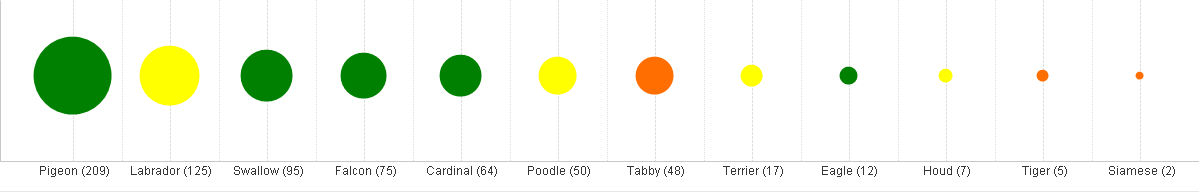
I am looking to create a linear bubble chart to show grouped values.
I want the bubbles to be in a single line, descending in size, with the grouping driving the color:
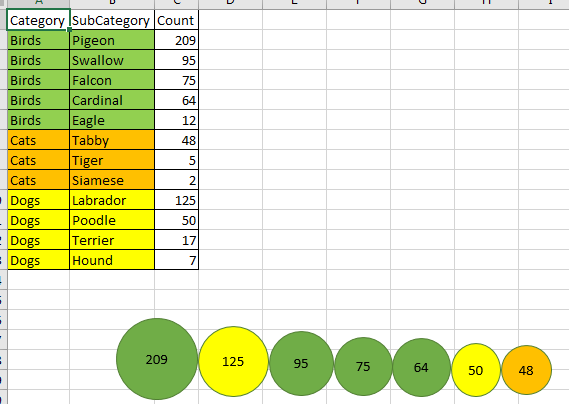
So Category drives what color it would be, the SubCategory is the bubble, and the count determines the size of the bubble. I want to sort descending by count, so the colors won't stay grouped together, necessarily.
Can this be done in Qlik, and how? I'm struggling to get scatter chart to work right cause it won't work without a 'Y' axis (which I don't need/want - since they need to just be in a line). I also can't figure out how to keep similar Category items the same color.
Any help would be appreciated. Thank you!
- Mark as New
- Bookmark
- Subscribe
- Mute
- Subscribe to RSS Feed
- Permalink
- Report Inappropriate Content
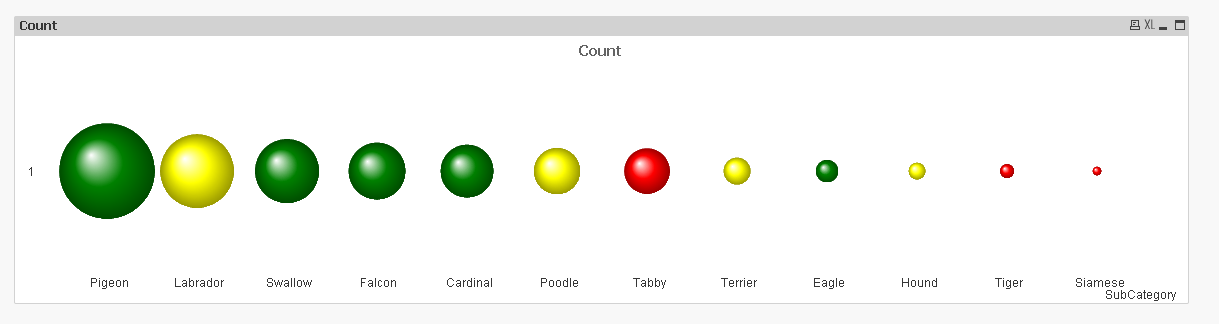
Like this?
- Mark as New
- Bookmark
- Subscribe
- Mute
- Subscribe to RSS Feed
- Permalink
- Report Inappropriate Content
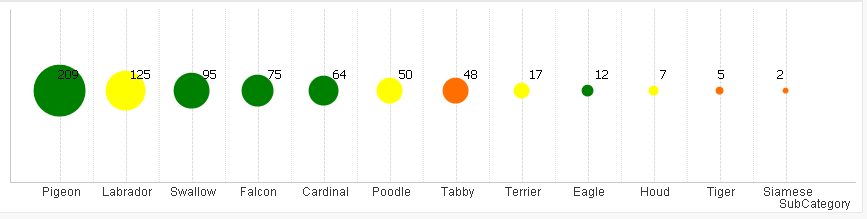
on top of Sunny's solution if you want to show numbers then you can achieve it by using a text on chart options as below.
It is not perfect.
- Mark as New
- Bookmark
- Subscribe
- Mute
- Subscribe to RSS Feed
- Permalink
- Report Inappropriate Content
Doesn't look right when selection is made
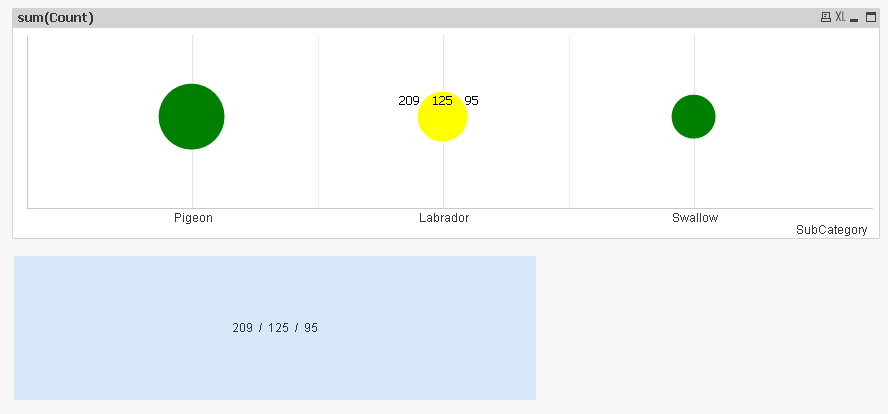
Are there other options?
- Mark as New
- Bookmark
- Subscribe
- Mute
- Subscribe to RSS Feed
- Permalink
- Report Inappropriate Content
you are right I tried to create a dynamic spacing as per the total width of the chart but it seems the PIXEL and Space ('') has diff.
by the way another way is to have these numbers along with the dimension values:
using dimension as below
=SubCategory&' ('& aggr(sum(Count),SubCategory)&')'
- Mark as New
- Bookmark
- Subscribe
- Mute
- Subscribe to RSS Feed
- Permalink
- Report Inappropriate Content
Looks much better
- Mark as New
- Bookmark
- Subscribe
- Mute
- Subscribe to RSS Feed
- Permalink
- Report Inappropriate Content
thnx a lot.